
Asma Khalid1, Ayesha Sadiqa2, Nargis Abdul Rehman3, Muhammad Bilal4, Tasleem Inayat5
Author affiliations:
- Principal, Lahore Institute of Nursing & Allied Health Sciences, Lahore, Pakistan; E-mail: asmakhalid.asma@gmail.com
- Associate Professor & Head, Department of Physiology, Institute of Dentistry, CMH Lahore Medical College, Lahore, Pakistan; E-mail: ayeshaias@yahoo.com
- Principal, Saeed Afridi College of Nursing & Allied Health Sciences, E-mail: nargisrehman111@gmail.com
- Principal, Rehman College of Nursing, Khanewal, Pakistan; E-mail: basitdullu786@gmail.com
- Nursing Instructor, Postgraduate College of Nursing. ; E-mail: kousermsn@gmail.com
Correspondence: Ayesha Sadiqa, Email: ayeshaias@yahoo.com Phone: +92 334 4102083
Abstract
Background: The present study evaluated the association of pre-operative pain education with the postoperative pain perception among the patients undergoing coronary artery bypass grafting (CABG).
Methodology: This randomized controlled trial was performed with cardiac patients undergoing CABG at Punjab Institute of Cardiology (PIC), Lahore. Eighty patients (47 males and 33 females) were selected and randomly assigned, either to the interventional group (40 patients) or the control group (40 patients). Those with any psychiatric disorder, past pain history, and those addicted to the opioids were excluded. The interventional group received preoperative pain education (booklet by Canadian Pain Society). Pre-operative and post-operative pain questionnaires including Brief Pain Inventory (BPI) scales were study tools. Chi-square and independent t-test, were used for association and comparison respectively.
Results: No significant difference was found between comparative groups regarding pre-operative pain perception, while significant difference was noted between the two groups regarding post-operative clarification of pain management (P < 0.001), preparedness for stronger analgesics (P < 0.001), risk of analgesia dependence (P < 0.001), fear of nausea related to pain-killers (P < 0.001), and threat of constipation with use of analgesics (P < 0.001). BPI scale showed that the average pain score of interventional and control groups were 17.25 ± 5.26 and 32.17 ± 2.51 respectively.
Conclusion: CABG patients who received preoperative pain education reported significantly less postoperative pain after the CABG, compared to the controls.
Abbreviations: BPI: Brief Pain Inventory; CABG: Coronary artery bypass grafting; ICU: Intensive care unit; POPM: Postoperative pain management
Key words: Preoperative, Postoperative, BPI scale, Pain perception, Cardiac patients.
Citation: Khalid A, Sadiqa A, Rehman NA, Bilal B, Inayat T. Association of preoperative pain-related education with postoperative patient care among in-hospital cardiac patients. Anaesth. pain intensive care 2022;26(5): 756-766; DOI: 10.35975/apic.v26i6.2046
Received: July 9, 2022; Reviewed: August 12, 2022; Accepted: September 23, 2022
Introduction
Post-surgical pain is somewhat distinctive from the pain experienced as a result of numerous chronic illnesses such as musculoskeletal pathologies.1 Poor pain control can lead to several postoperative complications; e.g., deep vein thrombosis, pulmonary embolism, and pneumonia; all of which not only increase the treatment cost and hospital stay but reduce patient safety and satisfaction.2
After cardiac surgery, patients’ overall recovery is affected by their subjective experience of pain. Postoperative discomfort is the most poorly handled symptom reported after heart surgery and in this regard several factors transmit their role including patient views, cultural values, physiological characteristics, hospital policies, and healthcare staff’ knowledge and opinions. Ineffective pain management undoubtedly causes an imbalance in physiological homeostasis that further reduces quality of life and even increases morbidity.3 In order to achieve best possible patient care, the nurses working in the intensive care unit (ICU) must assess pain and the best way to measure pain is by the patient’s self-report, which should be collected whenever possible.4 The most valid and trustworthy method for measuring postoperative pain is a numerical rating scale that is unidimensional and simply measures pain severity. Due to tissue damage and inflammation at the surgical site, patients endure severe pain after surgery.5 The clinical and psychological health of the patients can be affected by untreated acute postoperative pain, and if left unaddressed, it leads to chronic pain, which is an additional burden on the healthcare system.6
Pain is the primary symptom that brings the patients to the hospital and it is also the most prevalent complaint affecting about 79 % of hospitalized patients. Adequate pain assessment is important in order to alleviate pain with minimal side-effects.7 Nurses role is vital in patients’ pain evaluation and management, and their awareness of pain is crucial to inpatient care. Implementing the medicine, which the doctor prescribes and using the non-pharmacological therapies can play a significant part in enhancing care quality and reducing treatment costs.4
Despite advances in postoperative pain management (POPM), the majority of patients continue to experience extreme pain after surgery. Evidence suggests that continued education and training, as well as the use of standardized, validated tools, can help to deliver optimal postoperative in-hospital care to the patient.8
We evaluated the association of pre-operative pain education to coronary artery bypass grafting (CABG) patients on the postoperative pain perception after the surgery.
Methodology
A randomized control trial (RCT) was carried out from April to December 2019. Ethical concerns were taken into account in accordance with Helsinki’s declaration of ethical principles and approval was granted by the University of Health Sciences (UHS) research ethics committee. The study participants were the in-hospital patients waiting for CABG in the next 14 days at the Punjab Institute of Cardiology (PIC).
A simple random sampling technique was used to select the sample population and then informed consent was taken from each participant with an assurance of confidentiality. We enrolled a total of 80 patients in the study population, of which 47 were males and 33 were females. The age ranged from 50 to 80 y. All those with any psychiatric disorder, with pain in their past medical history, and addicted/allergic to opioids were excluded from the study. The patients were randomly sub-categorized into interventional and control groups, each containing 40 participants.
Preoperative pain-related education was given to the interventional group one day before their surgery through a specific booklet “Pain relief after surgery”, designed by the Canadian Pain Society (CPS) while the control group was treated with routine in-hospital pre-operative care alone. A pilot-tested structured questionnaire containing demographic data, pre-procedural assessment of pain/analgesia perception, and post-operative pain therapy questionnaire (PPTQ) along with a brief pain inventory (BPI) scale was used as a study tool. The questionnaire contained all closed-ended questions, originally developed by the American Pain Society. Its content validity and reliability both were confirmed before practicing it.
The data regarding pre-procedural assessment of pain/analgesia perception was received from the study groups before their surgery, while the PPTQ along with BPI was taken from both groups postoperatively on the 5th postoperative day.
Statistical analysis
The data was analyzed through statistical software SPSS version 21. The chi-square test was used to compare and contrast the difference of opinion (pre-operative/post-operative) between both study groups. An independent sample t-test was applied to observe the significance of the difference between the two study groups in relation to BPI score. The value of alpha was taken as ≤ 0.05.
Results
Eighty subjects were included in the study with 40 as controls and 40 as interventional ones. The mean age of the study population was 61.05 ± 8.32 y. The youngest age was 50 y and the oldest subject was 80 y old. The majority 49 (61.3%) of the study population were between 55 to 65 y old, whereas the least number of subjects (8) were above 75 y old i.e. 10% only. The male to female ratio of the study population was 1.44:1. Most of them (97.5%) were married. Thirty subjects out of a total of 80 subjects were housewives, while 7 were on job and 7 were teachers by profession (Table 1).
Thirty-four subjects were with Sec/Higher Sec school certificates and only 7 graduated, while others were with a primary level of education (16) or illiterate (21) (Table 1).
| Table 1: Demographic facts of the study population. | |||
| Variables | Interventional
n = 40 |
Control
n = 40 |
Total
n = 80 |
| Age (y) | |||
| < 55 | 10 (25) | 3 (7.5) | 13 (16.3) |
| 55-65 | 19 (47.5) | 30 (75) | 49 (61.3) |
| 66-75 | 7 (17.5) | 3 (7.5) | 10 (12.5) |
| ≥76 | 4 (10) | 4 (10) | 8 (10) |
| Gender | |||
| Male | 24 (60) | 23 (57.5) | 47 (59) |
| Female | 16 (40) | 17 (42.5) | 33 (41) |
| Marital Status | |||
| Married | 40 (100) | 38 (95) | 78 (97.5) |
| Single | 0 | 2 (5) | 2 (2.5) |
| Occupation | |||
| Shopkeeper | 11 (27.5) | 6 (15) | 17 (21.3) |
| Teacher | 2 (5) | 5 (12.5) | 7 (8.8) |
| Landlord | 7 (17.5) | 8 (20) | 15 (18.8) |
| Job | 3 (7.5) | 4 (10) | 7 (8.8) |
| Engineer | 1 (2.5) | 2 (5) | 3 (3.8) |
| House-wife | 16 (40) | 14 (35) | 30 (37.5) |
| Education level | |||
| Illiterate | 13 (32.5) | 8 (20) | 21 (26.3) |
| Primary | 6 (15) | 10 (25) | 16 (20) |
| Sec/Higher Sec | 18 (45) | 16 (40) | 34 (42.5) |
| Graduation | 2 (5) | 5 (12.5) | 7 (8.8) |
| Data presented as n (%) | |||
The present study revealed a very significant response to all items of the PPTQ. In Q-1 they were asked about their past medical experience that ever a physician/nurse explained to them to call them as they felt the pain to treat it instantly? All the subjects of the interventional group responded positively to it and none of them denied it. Whereas, from the control group only 2% replied positively to this item and 38% replied negatively.
In Q-2 of the PPTQ when subjects were questioned whether they would like to take a stronger dose of pain medication if their pain was not relieved? Thirty-nine percent of the interventional group replied with ‘yes’ and only 25% replied with a ‘no’ to it, while only 12 (30%) from the control group replied with ‘yes’ to the same item and 28 (70%) replied with a ‘no’ to this item.
In Q-3 of the PPTQ study population was asked about the danger of getting an addiction to painkillers. Thirty-eight (95%) subjects from the interventional group disagreed but on the other hand, 35 (87.5%) participants of the control group agreed to it.
The difference in responses to Q-4 of the ‘PPTQ’ by interventional and control groups was also statistically significant (P < 0.005) in which the question was asked: did you agree or not that nausea from pain medicines cannot be relieved? The whole interventional group was in disagreement with this question while (37) 92.5% of subjects from the control group agreed with it.
Feedback of item 5: Constipation from pain-killer cannot be relieved; of PPTQ showed that the whole interventional group was in disagreement with this item. While in the control group 16 were in disagreement and 25 were in agreement (Table 2).
| Table 2: Response of study population to the PPTQ | |||||
| Questions | Response | Interventional
n (%) |
Control
n (%) |
χ2 | P-value |
| Q.1: Ever any medical person asked to call them when you are in pain? | Yes | 40 (100) | 2 (5) | 72.38 | < 0.001 |
| No | 0 | 38 (95) | |||
| Q.2: Would you accept even stronger drugs to relieve pain? | Yes | 39 (98) | 12 (30) | 11.11 | < 0.001 |
| No | 1 (2) | 28 (70) | |||
| Q. 3: Pain-killers cause addiction. | Strongly Disagree | 17 (42.5) | 1 (2.5) | 55.26 | < 0.001 |
| Disagree | 21 (52.5) | 4 (10.0) | |||
| Agree | 2 (5.0) | 31 (77.5) | |||
| Strongly Agree | 0 | 4 (10.0) | |||
| Q. 4: Incurable nausea is caused by pain-killers.
|
Strongly Disagree | 21 (52.5) | 2 (5.0) | 68.89 | < 0.001 |
| Disagree | 19 (47.5) | 1 (2.5) | |||
| Agree | 0 | 23 (57.5) | |||
| Strongly Agree | 0 | 14 (35.0) | |||
| Q. 5: Pain-killers cause constipation. | Strongly Disagree | 15 (37.5) | 1 (2.5 | 76.25 | < 0.001 |
| Disagree | 25 (62.5) | 15 (37.5) | |||
| Agree | 0 | 24 (60.0) | |||
| Strongly Agree | 0 | 1 (2.5) | |||
Out of all positive responses from the study population (including both interventional and control groups) to Q-1, the highest (16) positive responses were received from the age group of 56-65 y, while the least (4) positive responses were acknowledged from those who were above 76-year-old. Although from all negative responses from the study population to Q-1, the maximum number (24) of responses were from 56-65 y old subjects and only 3 negatively responses were obtained from 66-75 y old subjects. Of all those subjects who agreed to the Q-2, highest number of respondents (34) were aged from 56 to 65 y and the same age group showed a maximum count of 6; who replied negatively to the same item (Table 2a).
Of all the study subjects, among those who disagreed with Q-3 maximum number (16) was of less than 55 y of age and the least number of responses (4) who disagreed were from more than 76 y of age group. Whereas, those who agreed to Q-3 mostly (26) belonged to the 56-65 y old age group. Fifteen respondents who disagreed with Q-4 were less than 55 y old and 15 were aged from 56-65 y while only 5 participants from all those who disagreed were above 76 y. On the other hand, 25 respondents from all those who agreed to Q-4 belonged to 56-65 y age group and 3 who agreed were 66-75 y old. Three more who agreed to Q-4 were above 76 y old. The difference in responses to Q-4 amongst all age groups was also statistically significant with P = 0.04. Related to Q-5, the age-related facts showed that the maximum number (15) of all those who disagreed with Q-5 were of 56 to 65 y of age. While the least disagreeing respondents (4) were of more than 76 y old. On the other hand, out of those who showed agreement with Q-5 the highest number (25) were from the 56-65 y age group and the least number (3) were from the 66-75 y old group (Table 2a).
| Table 2a: Statistical analysis with respect to age groups in response to the PPTQ | ||||||
| Questions | Response | Age (y) | P-value | |||
| ≤ 55 | 56-65 | 66-75 | ≥ 76 | |||
| Q.1: Ever any medical person asked to call them when you are in pain? | Yes | 14 (33.5) | 16 (38) | 8 (19) | 4 (9.5) | 0.17 |
| No | 7 (18.5) | 24 (63) | 3 (8) | 4 (10) | ||
| Q.2: Would you accept even stronger drugs to relieve pain? | Yes | 19 (28.4) | 34 (50.7) | 9 (13.4) | 5 (7.5) | 0.31 |
| No | 2 (15.4) | 6 (46.2) | 2 (15.4) | 3 (23.1) | ||
| Q.3: Pain-killers cause addiction. | Strongly Disagree | 6 (33.8) | 7 (38.9) | 3 (16.7) | 2 (11.1) | 0.13 |
| Disagree | 10 (40) | 7 (28%) | 6 (24) | 2 (8) | ||
| Agree | 5 (15.2) | 23 (69.7) | 2 (6.1) | 3 (9.1) | ||
| Strongly Agree | 0 | 3 (75%) | 0 | 1 (25. 8) | ||
| Q.4: Incurable nausea is caused by pain-killers.
|
Strongly Disagree | 7 (30) | 7 (30.4) | 6 (26.1) | 3 (13) | 0.04 |
| Disagree | 8 (40) | 8 (40) | 2 (10) | 2 (10) | ||
| Agree | 4 (17.4) | 15 (65.2) | 2 (8.7) | 2 (8.7) | ||
| Strongly Agree | 2 (14.4) | 10 (71.4) | 1 (7.1) | 1 (7.1) | ||
| Q.5: Pain-killers cause constipation. | Strongly Disagree | 6 (37.5) | 5 (31.3) | 2 (12.5) | 3 (18.8) | 0.328 |
| Disagree | 8 (32) | 10 (40) | 6 (24) | 1 (4) | ||
| Agree | 3 (20) | 8 (53.3) | 2 (13.3) | 2 (13.3) | ||
| Strongly Agree | 4 (16.7) | 17 (70.8) | 1 (4.2) | 2 (8.3) | ||
All subjects who agreed to Q-1 were married while there were 36 (94.7%) subjects who replied negatively. All those 42 (100%) who agreed to Q-2 were married and among all those who denied Q-2, the majority of 36 (94.7%) were married. The whole population (43) who disagreed with Q-3 were all married while those who agreed (34) were married and only 2 were single. All the participants who showed disagreement with Q-4 were married and those who agreed mostly (35) were married. Those who agreed (41) to Q-5 all were married, moreover, those who disagreed (37) were also married and only 2 with disagreements were single (Table 2b).
| Table 2b: Statistical analysis with respect to marital status in response to the PPTQ | ||||
| Questions | Response | Marital Status | P-value | |
| Married
n (%) |
Single
n (%) |
|||
| Q.1: Ever any medical person asked to call them when you are in pain? | Yes | 42 (100) | 0 | 0.13 |
| No | 36 (94.7) | 2 (5.3) | ||
| Q.2: Would you accept even stronger drugs to relieve pain? | Yes | 65 (97) | 2 (3) | 0.528 |
| No | 13 (100) | 0 | ||
| Q. 3: Pain-killers cause addiction. | Strongly Disagree | 18 (100) | 0 | 0.40 |
| Disagree | 25 (100) | 0 | ||
| Agree | 31 (93.9) | 2 (100) | ||
| Strongly Agree | 4 (100) | 0 | ||
| Q. 4: Incurable nausea is caused by pain-killers.
|
Strongly Disagree | 23 (100) | 0 | 0.44 |
| Disagree | 20 (100) | 0 | ||
| Agree | 22 (95.5) | 1 (4.3) | ||
| Strongly Agree | 13 (92.9) | 1 (4.3) | ||
| Q. 5: Pain-killers cause constipation. | Strongly Disagree | 16 (100) | 0 | 0.18 |
| Disagree | 25 (100) | 0 | ||
| Agree | 15 (100) | 0 | ||
| Strongly Agree | 22 (91.7) | 2 (8.3) | ||
Of all those who agreed to Q-1, the majority of 19 (45.2%) were with secondary/higher secondary level of education, while only 3 of them graduated. Similarly of those who disagreed with Q-1, the majority of 15 (39.5%) were again with secondary/higher secondary education level and only 5 were those who disagreed with it were graduated. Out of all who agreed to item 2, the majority of 26 (38.8%) were with secondary/higher secondary school certificates and only 6 (9%) of them graduated. Likewise of all those who disagreed with Q-2, their majority 8 (61.5%) were again with secondary/higher secondary level of education and only a single subject was illiterate. Education-wise, out of all those who disagreed or agreed with Q-3, mostly (12 with disagreement, 12 with agreement) were with secondary/higher secondary level of education. While least (5) of those who disagreed or agreed with Q-3 were graduated. Education-related facts showed that from all those who disagreed/agreed to Q-4, mostly (18 with disagreement, 12 with agreement) were with secondary/higher secondary level of education. While least of those who disagreed (3) with Q-4 were at graduation level by education and the least respondents who agreed (2) with item 4 were illiterate. Education-wise most of the participants who disagreed (18) or agreed (16) with Q-5 belonged to sec./higher sec. level of education (Table 2c)
| Table 2c: Statistical analysis with respect to occupation in response to the PPTQ | ||||||||
| Questions | Response | Occupation | P | |||||
| Shop-
keeper |
Teacher | Landlord | Engineer | Job | Housewife | |||
| Q.1: Ever any medical person asked to call them when you are in pain? | Yes | 11 (26.2) | 2 (4.8) | 7 (16.7) | 1 (2.4) | 3 (7.1) | 18 (42.9) | 0.05 |
| No | 5 (13.5) | 5 (13.5) | 8 (21.6) | 2 (5.4) | 5 (13.5) | 12 (32.4) | ||
| Q.2: Would you accept even stronger
drugs to relieve pain? |
Yes | 14 (21.2) | 5 (7.6) | 12 (18) | 3 (4.5) | 6 (9.1) | 26 (39.4) | 0.79 |
| No | 2 (15.4) | 2 (15.4) | 3 (23.1) | 0 | 2 (15.4) | 4 (30.8) | ||
| Q. 3: Pain-killers cause addiction. | Strongly Disagree | 9 (50) | 0 | 1 (5.6) | 1 (5.6) | 2 (11.1) | 5 (27.8) | 0.63 |
| Disagree | 2 (8) | 2 (8) | 6 (24) | 0 | 2 (8) | 13 (52) | ||
| Agree | 4 (12.5) | 4 (12.5) | 7 (21) | 2 (6.3) | 4 (12.5) | 11 (34.4) | ||
| Strongly Agree | 1 (25) | 1 (25) | 1 (25) | 0 | 0 | 0 | ||
| Q. 4: Incurable nausea is caused by
pain-killers.
|
Strongly Disagree | 4 (17.4) | 1 (4.3) | 3 (13) | 0 | 2
(8.7) |
13 (56.5) | 0.81 |
| Disagree | 7 (35) | 2 (10) | 5 (25) | 1 (5) | 1 (5) | 4 (20) | ||
| Agree | 3 (13) | 2 (8.7) | 5 (21) | 1 (4.3) | 3 (13) | 9 (39.1) | ||
| Strongly Agree | 2 (15.4) | 2 (8.7) | 2 (15) | 1 (17.7) | 2 (15.4) | 4 (30.8) | ||
| Q. 5: Pain-killers cause constipation. | Strongly Disagree | 4 (25) | 1 (6.3) | 1 (6.3) | 1 (6.3) | 1 (6.3) | 8 (50) | 0.97 |
| Disagree | 7 (28) | 1 (4) | 1 (4) | 1 (4) | 2 (8) | 8 (32) | ||
| Agree | 2 (13.3) | 1 (6.7) | 1 (6.7) | 0 | 3 (20) | 5 (33) | ||
| Strongly Agree | 3 (13) | 4 (17.4) | 4 (17.4) | 1 (4.3) | 2 (8.7) | 9 (39.1) | ||
A significant difference (P = 0.05) was observed between 6 categories of occupation who responded positive or negative to Q-1. The maximum number was 18, who replied positively to Q-1, all were housewives and 12 were the maximum responses who replied negatively were also housewives. Though only a single engineer agreed to Q-1 and 2 engineers disagreed with Q-1. Twenty-six (39.4%) subjects who agreed to Q-2 were housewives and among those who disagreed with them, 30.8% were again housewives. Only 3 (4.5) who agreed to Q-2 were engineers by profession while 2 from each occupational category of a shopkeeper, teacher, and on-job subjects replied negatively to Q-2.
Those who disagreed with Q-3, the maximum number (18) of responses received were housewives and the least number (1) of responses with disagreement was an engineer by profession. Similarly, all those who agreed with Q-3, were mostly (11) housewives, and with the least number (2) of disagreements were engineers by profession. Occupation-related statistics showed that the highest number (17) were housewives who disagreed with Q-4 and the single participant who disagreed with Q-4 was an engineer by profession. Likewise, the maximum agreements (13) were from housewives, and the least agreements (2) were observed from engineers. Most of the participants were housewives (16) who disagreed with Q-5, likewise, those who agreed with it were again mostly (14) housewives. Only a single participant who agreed to it was an engineer and from those who disagreed 2 of them were teachers, 2 were landlords and 2 were engineers by profession (Table 2d).
| Table 2d: Statistical analysis with respect to education in response to the PPTQ | ||||||
| Questions | Response | Education status | P-value | |||
| Illiterate | Primary | SSC/HSSC | Graduation | |||
| Q.1: Ever any medical person asked to call them when you are in pain? | Yes | 13 (31) | 7 (41.2) | 19 (45.2) | 3 (7.1) | 0.47 |
| No | 8 (21.1) | 10 (26.3) | 15 (39.5) | 5 (13.2) | ||
| Q.2: Would you accept even stronger drugs to relieve pain? | Yes | 20 (29.9) | 15 (22.4) | 26 (38.8) | 6 (9) | 0.25 |
| No | 1 (7.7) | 2 (15.4) | 8 (61.5) | 2 (15.4) | ||
| Q. 3: Pain-killers cause addiction. | Strongly Disagree | 2 (33.3) | 5 (27.8) | 6 (17.6) | 1 (5.6) | 0.58 |
| Disagree | 7 (28) | 3 (12) | 6 (33.3) | 1 (5.6) | ||
| Agree | 6 (18.2) | 8 (24.2) | 12 (48) | 3 (12) | ||
| Strongly Agree | 2 (50) | 1 (25) | 0
|
1 (25) | ||
| Q. 4: Incurable nausea is caused by pain-killers.
|
Strongly Disagree | 7 (30.4) | 6 (26.1) | 7 (30.4) | 3 (13) |
0.16 |
| Disagree | 8 (40) | 1 (5) | 11 (55) | 0 | ||
| Agree | 2 (8.7) | 6 (26.1) | 12 (52.2) | 3 (13) | ||
| Strongly Agree | 4 (28.6) | 4 (28.6) | 4 (28.6) | 2 (14.3) | ||
| Q. 5: Pain-killers cause constipation. | Strongly Disagree | 3 (18.8) | 2 (12.5) | 9 (56.3) | 2 (12.5) |
0.37 |
| Disagree | 10 (40) | 2 (12.5) | 9 (36) | 1 (4) | ||
| Agree | 2 (13.3) | 3 (20) | 9 (60) | 1 (6.7) | ||
| Strongly Agree | 6 (25) | 7 (29.2) | 7 (29.2) | 4 (16.7) | ||
Responses to all of the items of the pre-operative pain questionnaire (PPQ) showed insignificant differences between interventional and control groups. In Q-1 (How much pain do you expect to have after your operation?) the received feedback from most (33%) of the participants of the interventional group revealed that they don’t know exactly about it and only 18% responded with expected mild pain after surgery. In the control group majority (40%) of participants showed that they expected moderate pain after surgery and only 10% of the whole control group expected mild pain after surgery (Figure 1).
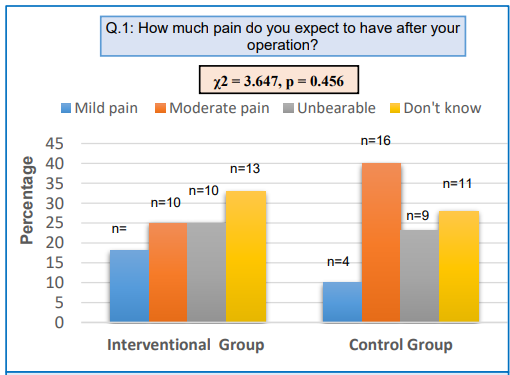
Figure 1: Comparative analysis of interventional and control groups in response to Q-1 of the PPQ.
Twenty-eight (70%) participants from the interventional group opted for injectable/needle as the route of administration for pain relief medicine asked in Q-2 of the PPQ and only 2 (5%) of them opted for skin patch as a route of drug administration for pain relief. From the control group, 60% of participants selected injectable/needle; while only 2 (5%) liked to take medicines through a skin patch as a route of drug administration of pain relief (Figure 2).
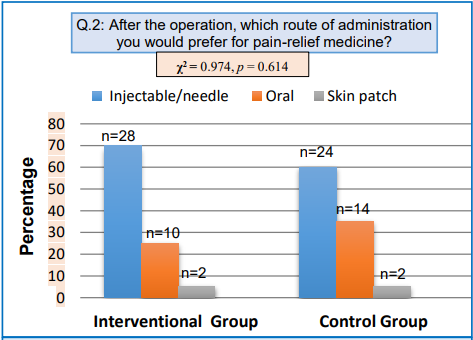
Figure 2: Comparative analysis of interventional and control groups in response to Q-2 of the PPQ
The response from the interventional group to Q-3 of the PPQ showed that 60% of them would like to ask for post-surgical pain-relief medicines only in case of severe pain and the same is the case with the control group 50% of them would like to ask pain-relief medicines only in case of severe post-surgical pain. Whereas none agreed to bear pain rather than to take medicine (Table 3).
When participants were asked in Q-4 of the PPQ that if required when would they expect painkillers to be given to them? Sixty percent from the interventional group and 47% from the control group responded to take it immediately as soon as they experienced pain. Only 5% of each studied group responded that they wait for the nurse to come and gave them medicine on her own otherwise they would not call them (Table 3).
In Q-5 of the PPQ when study groups were asked what type of non-drug treatment they would choose for their pain; 45% from the interventional group preferred a massage, while 42% from the control group preferred to take support from a pillow. None of both groups relied on music/reading/TV or related (Table 3).
| Table 3: Statistics of the study population about their responses related to the pre-operative pain therapy questionnaire. Data given as n (%). | ||||||
| Items | 4-point Likert scale response* | Interventional Group
N = 40 |
Control Group
N = 40 |
Chi-Square Test | ||
| χ2 | P | |||||
| Q 3: If you have pain after surgery,
when would you ask for pain-relief medicine? |
A | When having some pain | 12 (30) | 16 (40) | 0.935
|
0.626 |
| B | When pain becomes severe | 24 (60) | 20 (50) | |||
| C | Wait until it is offered | 4 (10) | 4 (10) | |||
| D | Put up with the pain rather than have medicine | 0 | 0 | |||
| Q 4: If you ask for pain-relief medicine, when would you expect it to be given? | A | Immediately, having put up with the pain for as long as possible | 24 (60) | 19 (47) | 1.356 | 0.715 |
| B | Immediately, unless the nurse was interrupted by an emergency | 10 (25) | 14 (35) | |||
| C | When the nurse isn’t busy | 4 (10) | 5 (13) | |||
| D | Next time the nurse is giving medication | 2 (5) | 2 (5) | |||
| Q 5: What kind of non-drug treatment
do you want to use for pain relief? |
A | Pillow to support incisions during movement | 13 (32) | 17 (42) | 1.933 | 0.380 |
| B | Massage | 18 (45) | 12 (30) | |||
| C | Application of heat | 9 (23) | 11 (28) | |||
| D | Music, reading, TV, or other distracting activities. | 0 | 0 | |||
Statistics related to BPI also showed that there was a significant difference (P = 0.0006) between the responses from interventional as well as control groups when both groups were asked that other than minor headaches or a toothache, did they experience any other type of pain in their daily life.
Similarly, when responses from both the studied groups were assessed to see the significance of difference against the Q-2 (rate your pain with suitable number that best describes your worst pain in the past 24 h) in BPI, we found a very significant difference (P = 0.0002) between the responses of both the groups. We found a high mean in the interventional group compared to the control group in this regard.
Both the groups again asked in Q-3 of BPI that rate your pain by number when it was at its least in past 24 h. The difference between the means of responses from both groups showed statistical significance (P = 0.0001).
For Q-4 in which both comparative groups were asked to rate their average pain in the past 24 h with a number. We observed a statistical difference between the means of responses from both groups with P = 0.0001.
In BPI when both the groups were asked in Q-5 that rate your pain at this time by a number (from the provided option). A high mean number was observed in the control group compared to the interventional group and statistically, we found a very significant difference between the responses of both the groups (0.0001).
Addressing the last question of BPI, the participants were asked to choose a percentage that showed their degree of relief from the pain medication. A high statistical difference was obtained from the interventional group in response to that question compared to the control group.
The overall comparison between the interventional and the control group on the BPI scale showed that the average pain score of the interventional group was 46.6% less than the mean pain scores of the control group (Table 4).
| Table 4: Statistics of study population related to the brief pain inventory (BPI). | |||||
| No. | Questions | Interventional | Control | Independent samples t-test | |
| Mean ± SD | Mean ± SD | t | P | ||
| 1 | Throughout our lives, most of us have had pain from time to time (such as minor headaches, sprains, and toothaches). Have you had pain other than these everyday kinds of pain today? | 1.00 ± 0.00 | 0.75 ± 0.44 | 3.59 | 0.0006 |
| 2 | Please rate your pain by circling the one number that best describes your pain at its worst in the past 24 h. | 7.05 ± 1.85 | 8.33 ± 0.86 | 3.96 | 0.0002 |
| 3 | Please rate your pain by circling the one number that best describes your pain at its least in the past 24 h. | 5.08 ± 1.62 | 7.98 ± 0.86 | 10 | 0.0001 |
| 4 | Please rate your pain by circling the one number that best describes your pain on average in the past 24 h. | 3.23 ± 1.27 | 8.00 ± 1.04 | 18.37 | 0.0001 |
| 5 | Please rate your pain by circling the one number that tells how much pain you have right now. | 1.90 ± 1.08 | 7.83 ± 1.34 | 21.79 | 0.0001 |
| 6 | In the past 24 h, how much relief has pain treatment or medication provided? Please circle the one percentage that most shows how much relief you have received. | 90.50 ± 5.52 | 46.00 ± 17.22 | 15.56 | 0.0001 |
| Mean pain scores | 17.25 ± 5.26 | 32.13 ± 2.51 | −16.14 | < 0.0001 | |
Discussion
Several modified strategies can be incorporated in order to achieve excellence in postoperative pain management. Canadian Institutes of Health Information’s Cardiac Care Quality Indicators Report of 2017 also emphasized acquiring advanced opportunities to keep on improving the standards of postoperative cardiac care in Canada.9 Pain-related patient education also improves the basic knowledge and abilities of the patients, so that they can manage pain by themselves after their discharge from the hospital.10 A study reported that old erroneous beliefs based on inaccurate knowledge were one of the prime contributors to ineffective postoperative acute pain management.11
In the year 2015, a systematic review concluded that the efficacy of preoperative education for patients with heart surgeries was still not confirmed in most of the developing world. So more studies in this regard could help to clear this grey information and will lead to targeted training of the paramedics, which could increase the effectiveness of the best postoperative services and achieve more patient satisfaction.2 The significant role of pre-operative pain-related patient education to attain better postoperative patient care has been supported by literature, especially in complex surgical procedures.10 The subjective fear related to cardiac surgical interventions can never be ruled out which may potentiate the risk of anxiety related physiological changes in such patients; moderate to high levels of anxiety at the preoperative stage showed significantly elevated pain scores at the postoperative phase compared to those who had mild anxiety at the preoperative stage.12
Similar to the present study, another randomized controlled trial was performed by Azizi et al. in 2020 on the patients who underwent spinal surgeries and reported the parallel findings of enhanced patients’ response to postoperative pain handling in that group who received pain-related education preoperatively than the control group.13 A systematic review by Ramesh et al. in 2017 also concluded that preoperative analgesia-related patient education lead to a decline in postoperative anxiety amongst cardiac patients who received the surgical intervention.14
Another review stated that preoperative educational sittings catering to the medicinal, emotional, and monetary aspects with patients, who underwent spinal surgeries, undoubtedly reduced their depression/fear and improved their pain-related perception. Thus, encouraging them to respond in a better way to postoperative patient management.15 Klaiber et al. declared in their study in the year 2018 that seminars for preoperative education to the patients admitted for visceral surgeries led to an increase in the satisfaction level in such patients in terms of pain perception and mood elevation.16 Another study by Michal et al., (2019) also suggested the need to educate patients before their cardiac surgery in relation to drug addiction, side effects of the drugs, and physical movements in order to improve their pain perception in postoperative period.17
An observational study from India (2019) stated that 80.5% of patients with acute postoperative pain reported the negligible use of non‑pharmacological pain-relief methods.18 The present study showed that 42% of all controls agreed to use pillow support, while 45% from the interventional group were willing to use massage as a non-drug treatment for pain relief. However, the relevance of various kinds of non‑medicinal support as adjunct pain-relief measures can never be denied by the literature.19 The current study observed that preoperative patient education leads to a decline in the mean pain scores of patients after cardiac surgery. On the same grounds another study from Turkey in 2018 found that preoperative individualized education to cardiac patients has a significant role in dropping their anxiety and thereby reducing their postoperative pain scores.20 Although various other subjective traits like anxiety intensities, sentiments, and poor individual approach to a problem all may exacerbate the feeling of pain.4
A study by Sharma et al. declared that 100% of the patients felt postoperative pain during the very first 24 h after the operation. Their average pain score was 4.9, and the worst pain grade was 7.6 at that time.21 While results of the present study revealed that the mean pain score was 3.23 ± 1.27 in the interventional group and comparatively high i.e. 8.00 ± 1.04 in the control group, whereas the worst pain grade was 7.05 ± 1.85 in the interventional group and 8.33 ± 0.86 in the control group. Venkatesan et al. in 2021 declared perception of severe postoperative pain by 70% of patients with general surgeries.22 In contrast, according to the present study only 25% of the cardiac patients from the interventional group and 23% from the control group showed unbearable pain expectancy when they were questioned preoperatively. Comparatively Ramia et al. reported that 50% of obstetric and 37% of orthopedic patients had experienced severe pain postoperatively.23
The average pain score among all patients of non-cardiac surgery with anesthesia was 20 ± 8 by Turan et al. in 2020.24 While on BPI the average pain score was noted much lower in the interventional as well as the control groups i.e. 1.90 ± 1.08 and 7.83 ± 1.34 respectively in the current study.
Limitations
The sample size of our study was small. In the future, similar studies if conducted in prospective cohort designs and with a larger sample size would definitely provide more clarity about the effectiveness of preoperative pain-related patient education.
Conclusion
Pre-operative pain-related education to in-hospital cardiac patients admitted for CABG, played a significant role to achieve more effective post-operative patient care by enhancing the satisfaction level among patients. It also improves the patients’ fears related to side effects of pain-relief medicines, and also encourages them to communicate to medical staff if and when they feel pain. As measured on the Brief Pain Inventory, prior educated patients significantly exhibit much lower pain scores as compared to the controls.
Acknowledgment
We acknowledge all the participants of the study for their cooperation in the process of data collection.
Data availability
The numerical data generated during this research is available with the authors.
Conflict of interest
The study utilized no external or industry funding. The authors declare no personal conflict of interest.
Authors’ contribution
AK, NAR: Literature search, concept, study design, conduct the study, data collection, data analysis
AS, MB, TI: Literature search, data collection, data analysis. manuscript writing, editing and correction, final approval
References
- Akhtar J. Challenges in the management of postoperative pain. J Surg Pak. 2022;27(1):1-2. [Free Full Text]
- Ferdoush J, Chowdhury RP, Johora F, Arifina R, Jeenia FT, Ata M, et al. Post-operative pain management and patient satisfection, experience at a tertiary care hospital. Chatt Maa Shi Hosp Med Coll J. 2021;20(2):69-73. DOI: 3329/cmoshmcj.v20i2.56478
- Khalid A, Kausar S, Sadiqa A, Abid A, Jabeen S. Relevance of preoperative pain education to the cardiac patients on their response to postoperative pain therapy, preoperative pain education to the cardiac patients. PBMJ. 2022;2(28):147-51. [Free Full Text]
- Gélinas C, Shahiri S, Richard-Lalonde M, Laporta D, Morin JF, Boitor M, et al. Exploration of a multi-parameter technology for pain assessment in postoperative patients after cardiac surgery in the intensive care unit, the nociception level index (NOL)TM. J Pain Res. 2021;14:37-23. [PubMed] DOI: 2147/JPR.S332845
- Baamer RM, Iqbal A, Lobo DN, Knaggs RD, Levy NA, Toh LS. Utility of unidimensional and functional pain assessment tools in adult postoperative patients: a systematic review. Br J Anaesth. 2022 May;128(5):874-888. [PubMed] DOI: 1016/j.bja.2021.11.032
- Belay Bizuneh Y, Fitiwi Lema G, Yilkal Fentie D, Woldegerima Berhe Y, Enyew Ashagrie H. Assessment of patient’s satisfaction and associated factors regarding postoperative pain management at the University of Gondar Compressive Specialized Hospital, Northwest Ethiopia. Pain Res Manag. 2020 Nov 12;2020:8834807. [PubMed] DOI: 1155/2020/8834807
- Zeleke S, Kassaw A, Eshetie Y. Non-pharmacological pain management practice and barriers among nurses working in Debre Tabor comprehensive specialized Hospital, Ethiopia. PLoS One. 2021 Jun 15;16(6):e0253086 [PubMed] DOI: 1371/journal.pone.0253086
- Kasahun HG, Agizew TB, Temesgen MM, Ashagrie HE. Assessment of acute postoperative pain management and associated factors after elective surgery among adult surgical patients, a prospective cross-sectional study. IJS Short Rep. 2022;7(1):e37. DOI: 1097/SR9.0000000000000037
- Tran DT, Welsh RC, Ohinmaa A, Thanh NX, Bagai A, Kaul P. Quality of acute myocardial infarction care in Canada, a 10-year review of 30-day in-hospital mortality and 30-day hospital readmission. Can J Cardiol. 2017 Oct;33(10):1319-1326. [PubMed] DOI: 1016/j.cjca.2017.06.014
- Tan M, Law LS, Gan TJ. Optimizing pain management to facilitate enhanced recovery after surgery pathways. Can J Anaesth. 2015 Feb;62(2):203-18. [PubMed] DOI: 1007/s12630-014-0275-x
- Wang Y, Liu Z, Chen S, Ye X, Xie W, Hu C, et al. Pre-surgery beliefs about pain and surgery as predictors of acute and chronic post-surgical pain, a prospective cohort study. Int J Surg. 2018 Apr;52:50-55. [PubMed] DOI: 1016/j.ijsu.2018.02.032
- Kashif M, Hamid M, Raza A. Influence of preoperative anxiety level on postoperative pain after cardiac surgery. Cureus. 2022;14(2):e22170. [PubMed] DOI: 7759/cureus.22170
- Azizi A, Khatibian M, Mohamadian A, Soltanian A, Salehzadeh Glonduz F. Effect of patient education about patient-controlled analgesia pump preoperative on severity of pain, nausea and vomiting after spinal culumn surgery. Avicenna J Nurs Midwifery Care. 2020;27(6):405-14. DOI: 30699/ajnmc.27.6.405
- Ramesh C, Nayak BS, Pai VB, Patil NT, George A, George LS, et al. Effect of preoperative education on postoperative outcomes among patients undergoing cardiac surgery, a systematic review and meta-analysis. J Perianesth Nurs. 2017 Dec;32(6):518-529.e2. [PubMed] DOI: 1016/j.jopan.2016.11.011
- Burgess LC, Arundel J, Wainwright TW. The effect of preoperative education on psychological, clinical and economic outcomes in elective spinal surgery, a systematic review. Healthcare (Basel). 2019 Mar 21;7(1):48. [PubMed] DOI: 3390/healthcare7010048
- Klaiber U, Stephan-Paulsen LM, Bruckner T, Müller G, Auer S, Farrenkopf I, et al. Impact of preoperative patient education on the prevention of postoperative complications after major visceral surgery, the cluster randomized controlled PEDUCAT trial. 2018 May 24;19(1):288. [PubMed] DOI: 10.1186/s13063-018-2676-6
- Micah S, Barolia R, Parpio Y, Kumar S, Sharif H. Factors associated with postoperative pain among patients after cardiac surgery in the tertiary care teaching hospital of Karachi, Pakistan. Pain Res Treat. 2019 Apr 1;2019:9657109. [PubMed] DOI: 1155/2019/9657109
- Komann M, Weinmann C, Schwenkglenks M, Meissner W. Non-pharmacological methods and post-operative pain relief, An observational study. Anesth Pain Med. 2019 Apr 20;9(2):e84674. [PubMed] DOI: 5812/aapm.84674
- van der Wal-Huisman H, Dons KS, Smilde R, Heineman E, van Leeuwen BL. The effect of music on postoperative recovery in older patients, A systematic review. J Geriatr Oncol. 2018 Nov;9(6):550-559. [PubMed] DOI: 1016/j.jgo.2018.03.010
- Ertürk EB, Ünlü H. Effects of pre-operative individualized education on anxiety and pain severity in patients following open-heart surgery. Int J Health Sci (Qassim). 2018 Jul-Aug;12(4):26-34. [PubMed]
- Sharma SK, Thakur K, Mudgal SK, Payal YS. Acute postoperative pain experiences and satisfaction with its management among patients with elective surgery, An observational study. Indian J Anaesth. 2020 May;64(5):403-408. [PubMed] DOI: 4103/ija.IJA_33_20
- Venkatesan U, Kamal S, Viswanathan J. Perception of pain, attitude and satisfaction of pain management among postoperative patients. J Clin of Diagn Res. 2021;15(1). DOI: 7860/JCDR/2021/45991.14457
- Ramia E, Nasser SC, Salameh P, Saad AH. Patient perception of acute pain management, data from three tertiary care hospitals. Pain Res Manag. 2017;2017:7459360. [PubMed] DOI: 1155/2017/7459360
- Turan A, Leung S, Bajracharya GR, Babazade R, Barnes T, Schacham YN, et al. Acute postoperative pain is associated with myocardial injury after noncardiac surgery. Anesth Analg. 2020 Sep;131(3):822-829. [PubMed] DOI: 1213/ANE.0000000000005033.
