Yvon F. Bryan MD1 and Kathleen N. Johnson BS,1 Zachary Riley BS,1 Peter Santago II PhD2,
1Department of Anesthesiology, Wake Forest School of Medicine, Winston-Salem, NC 27157, USA
2Department of Computer Science, Wake Forest University, Winston-Salem, NC 27109, USA
Running head: Airway assessment using digital imaging
Corresponding Author:
Yvon F. Bryan, MD
Department of Anesthesiology
Wake Forest School of Medicine
Medical Center Boulevard
Winston-Salem, NC 27157-1009 (USA)
Ph: 1+336-716-4498
E-mail: ybryan@wakehealth.edu
Abstract
Objective: Current predictive airway exams focus on the tongue, but are subjective in nature and vary largely depending on the clinician performing them. We aimed to develop a method using digital imaging to quantify the size and shape of the tongue and the area left unoccupied in the oral cavity. Our goal was to develop an alternative airway assessment that was precise and objective.
Methodology: Photographs were taken of our clinical research team. A total of 9 photographic images were taken and analyzed by 7 members via ImageJ software obtained from the National Institute of Health (NIH) to measure the size and shape of the tongue using an area (cm2) measurement, the area of the teeth, the area of the unoccupied space, the area of the entire oral cavity (minus lips). The ratio of the unoccupied area to the entire oral cavity was calculated by dividing the area of the unoccupied area by the area of the entire oral cavity and multiplying by 100. In addition, intra- and inter-rater reliabilities were also measured to assess the precision of the objective exam.
Results: A wide variety of sizes and shapes of tongues in the oral cavity was found. The ratio of the unoccupied area to the entire oral cavity ranged from 19.7 to 47.8. We also found a high precision defined by intra- and inter-rater reliability of 1.638×10⁻⁴ and 3.347×10⁻⁴, respectively.
Conclusion: Due to the variation in the sizes and shapes of the tongues, the unoccupied area left in the oral cavity differed among the images analyzed. Therefore, the ratio of the unoccupied area to the entire oral cavity varied extensively. Overall, our alternative method may allow for a more precise, objective airway assessment.
Keywords: airway assessment, digital imaging, ImageJ, oral cavity, tongue, unoccupied area
Introduction
Anesthesiologists use preoperative airway exams to assess the anatomical structures in the oral cavity in an attempt to predict which patients may be difficult to perform laryngoscopy and/or intubation.1 Many subjective airway exams have been developed, and though useful, there is a considerable lack of precision between different clinicians’ assessments.2-6 Imaging studies have been used in the past to assess different anatomic structures involved in airway management, but require expensive radiological equipment and/or complex software analysis.7
Mallampati classification is a widely used airway exam performed prior to airway management. It is determined by a visual assessment of how much the protruded tongue obstructs the view of the tonsillar pillars.1,8 Tongue size in relation to lingual fat has been proposed to correlate with, and possibly explain Mallampati classifications, with large tongues indicating higher likelihood for difficult intubation.9 The tongue may vary in both its size and shape in the oral cavity, and may impact airway management differently depending on these features. Thus, the unoccupied area in the oral cavity may be a better measurement to use. Additionally, the Mallampati exam has a low sensitivity and specificity; therefore, there is a need for an alternative precise, objective airway assessment.7,10
A simple, free software tool that uses digital imaging (DI) to measure the anatomic structures in the oral cavity may be an objective, precise, quick, and reliable method.11 The goal of our study was to use this DI software to measure the size and shape of the tongue, as well as the area available (or unoccupied) in the oral cavity. We then calculated a ratio of the unoccupied area to the rest of the oral cavity. Our secondary objective was to measure the intra- and inter-rater reliability to determine the precision of our method. We present our initial experience using DI as an objective tool for measuring anatomic structures, specifically the size and shape of the tongue, and the ratio of the unoccupied area to the oral cavity.
METHODOLOGY
Institutional Review Board approval was not required as the project was designed as an internal project and the research team members served as research subjects, though written consent was still obtained. ImageJ, a free National Institutes of Health (NIH) software available for Mac, Windows, and Linux operating systems, was downloaded from http://imagej.nih.gov/ij/download.html and installed on an encrypted computer. Competency of program operation was attained by the research personnel via tutorials and practice using the program. Microsoft Excel was used in conjunction with ImageJ as it provided the best way to quickly calculate the means, standard deviations, and ratios.
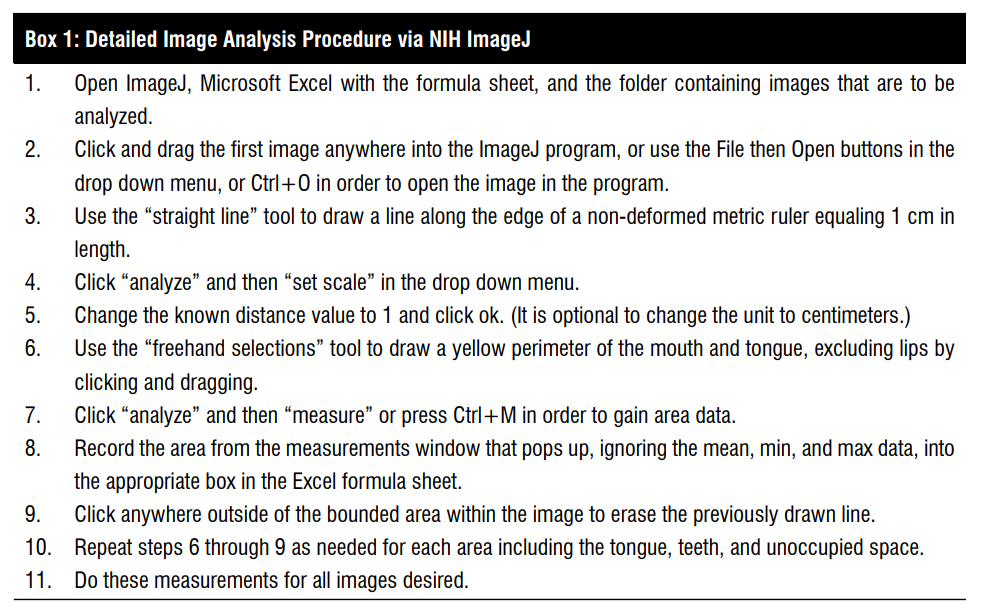
Images of 9 research team members were taken on an encrypted, password protected Apple iPad®. Each image contained the frontal view of the oral cavity with the tongue maximally protruded. Within the plane of the mouth opening, a metric ruler that depicted centimeters was placed beside the oral cavity. ImageJ was calibrated so that 1-cm distance was equal to a set number of pixels using the ruler in the image (figure 1a). Images were transferred to a computer, which took less than 3 minutes depending on the analyzer’s familiarity with the process.
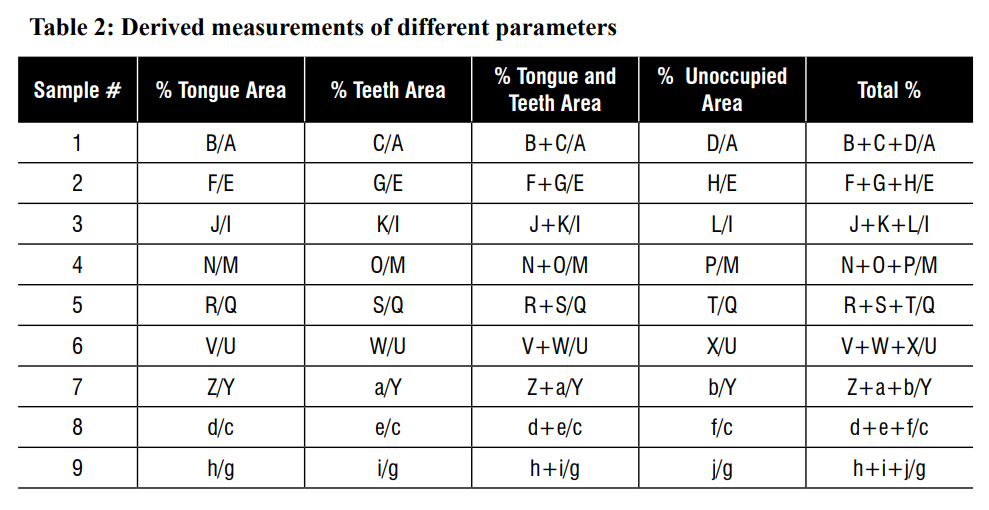
Using ImageJ’s measurement functions, the area of the entire oral cavity minus the lips was measured. The area occupied by the tongue was measured, followed by the area occupied by the teeth, and finally the unoccupied area within the oral cavity (figure1b). The total time required for analysis in ImageJ was less than 5 minutes depending on each individual’s familiarity with the program. The ratio of the unoccupied area in the oral cavity was calculated by dividing the area of the unoccupied area by the area of the entire oral cavity and multiplying by 100 (figure 1c). Each of these measurements was entered into a pre-made Excel® datasheet. Further details of the formulas in the datasheet and how to operate the ImageJ program are found in appendix A and appendix B, respectively. The shapes of the tongue were also determined.
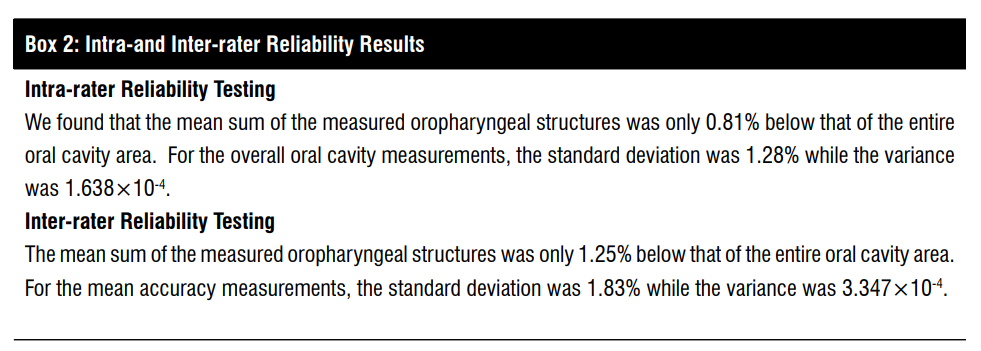
In order to measure precision, standard deviations and variances were found for the measurements of one photo taken by one rater repeated 6 times of the structures in the oral cavity (total area of oral cavity, percent area of tongue, teeth, teeth and tongue, and unoccupied area) to determine intra-rater reliability. Then, the standard deviations and variances were calculated for the mean values of each measurement of one photo between 7 different raters to determine inter-rater reliability. The means, standard deviations (SD), and variances were found using Microsoft Excel®.
RESULTS
Variability in Tongue Size and Shape
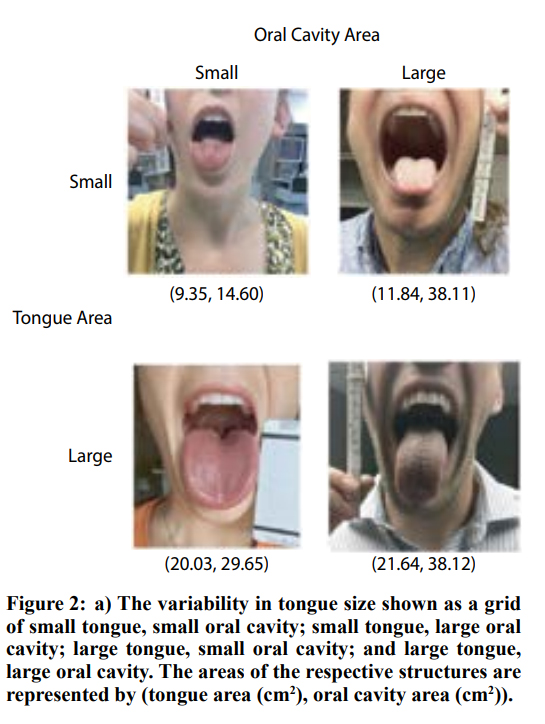
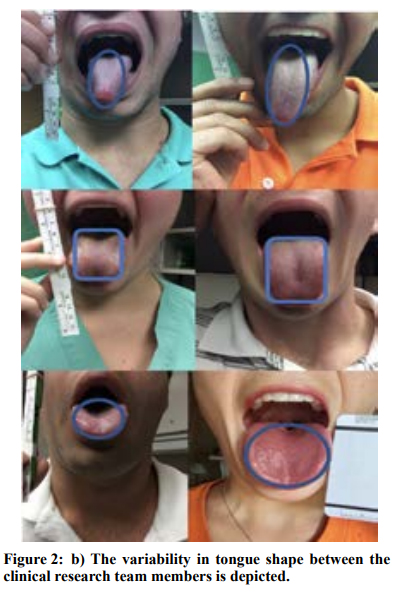
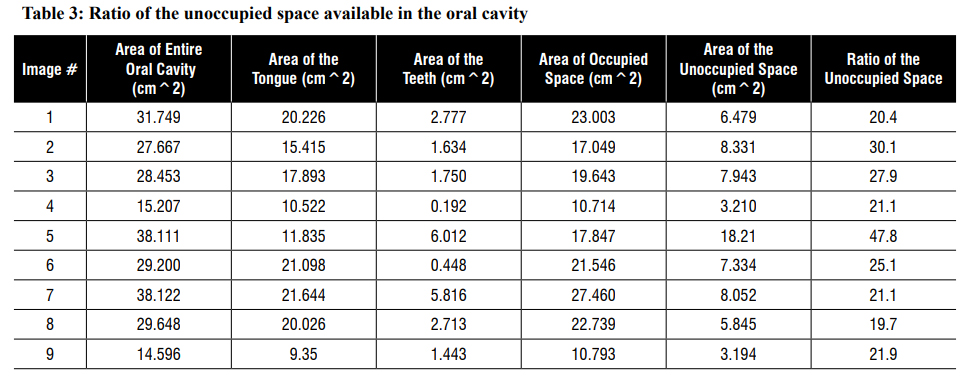
We found a wide variation in tongue sizes and shapes in relation to the oral cavity among the different images. The mean area of the tongue was 16.45 cm2 +/- 4.82 cm2 (9.35-21.64 cm2). The mean area of the oral cavity was 28.08 cm2 +/- 8.41 cm2 (14.60-38.12 cm2) (see figure 2a). See figure 2b for the variety of tongue shapes.
Ratio of Unoccupied area to the Oral Cavity
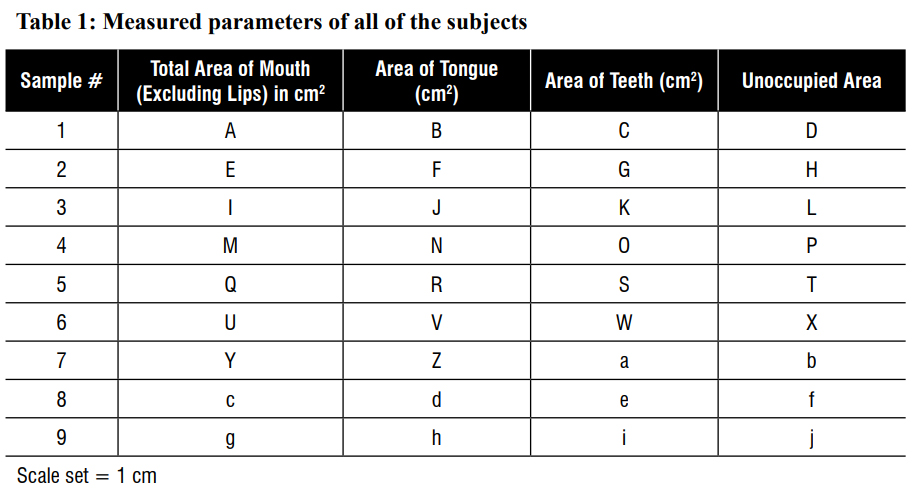
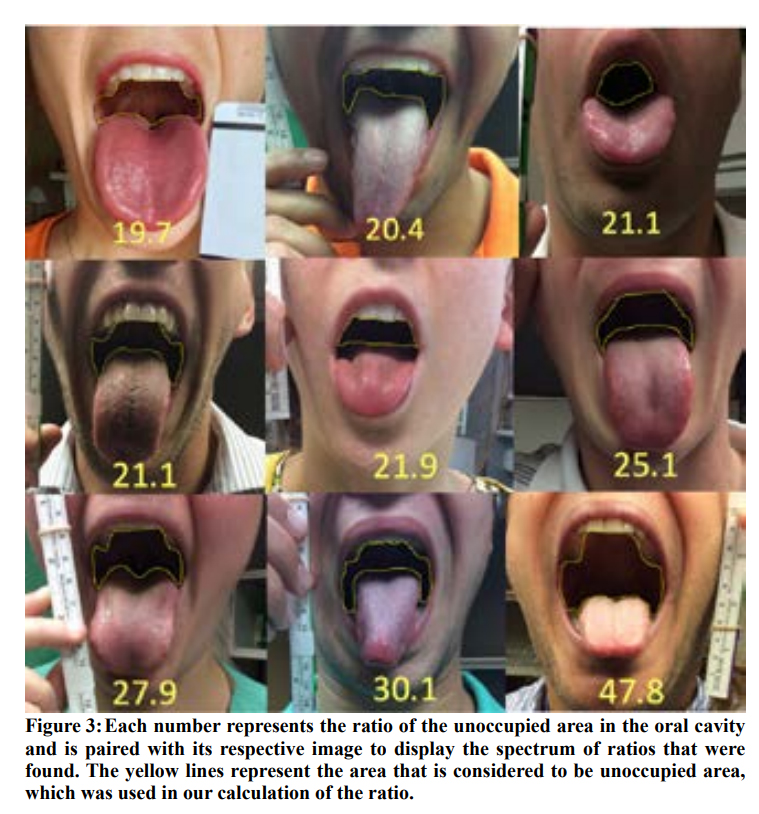
Table 1 shows the calculations of the ratio of unoccupied area in the oral cavity for each of 9 images. The ratios ranged from 19.7 to 47.8, with 19.7 representing the oral cavity with the least amount of unoccupied area available and 47.8 representing the oral cavity with the most amount of unoccupied area available. Figure 3 shows the ratio that was calculated with its respective image.
Precision Determined by Intra-rater and Inter-rater Reliability
The intra- and inter-rater reliability were 1.638×10⁻⁴ and 3.347×10⁻⁴, respectively indicating a high precision of the method (see Appendix C).
DISCUSSION
We found that there was a large variability in the digital imaging analysis of the sizes and shapes of tongues. We found that the size of the tongue was only important if given in relation to the rest of the oral cavity. Therefore, we calculated the ratio of the unoccupied area to the entire oral cavity, with small numbers meaning the tongue takes up a large proportion of the oral cavity leaving little unoccupied area to maneuver an airway device for intubation. Using our digital imaging technique with ImageJ software, our study obtained high intra- and inter-rater reliability. We believed that it was important to develop a more precise, objective airway assessment to quantify the tongue, since it is known that it plays a large role in predicting difficult airways. The tongue is the main component of the standard bedside preoperative airway assessment (Mallampati classification). The subjectivity of airway exams, including the Mallampati classification, and variability of different physician’s assessments of difficult airways lead to discrepancies.2
Many different imaging modalities have been used to assess structures in the oral cavity and/or for airway assessment such as analysis of facial features, the range of motion of the neck, and other anatomical features.7,12-14 For instance, complex facial features have been analyzed using DI in a population of Caucasian males. This facial recognition software assessed numerous features computationally to predict difficult laryngoscopy and intubation with very complex algorithms with high sensitivity and specificity.12 A study by Gupta et al.7 used maxillopharyngeal angles in order to predict difficult intubation using radiographs without respect to oral cavity structures. Their method, however, was expensive and exposed patients to radiation. Another study measured tongue sizes and masses in cadavers and correlated increased tongue sizes with high Mallampati classes.9
We believe that this correlation relates to the unoccupied area of the oral cavity rather than area directly occupied by the tongue. Tongue size was more directly assessed through the use of sonography in another study that compared tongue size with numerous other anatomical characteristics.14 Measurements by sonography and ImageJ did not indicate tongue size alone to be statistically significant between difficult and easy intubation, though hyomental distance in the head-extended position was found to be statistically significant.14 Our method stays consistent with the long-standing precedent for tongue protrusion as was used by Mallampati in his initial methodology.1 With a protruded tongue, anatomic structures have been assessed visually with consideration of a subjective view of the tonsillar pillars.8 Our study, however, aims to improve upon traditional and modified Mallampati test classification by removing subjectivity, and assigning a quantifiable ratio to the unoccupied area within the oral cavity, rather than limiting the options to a number I-IV.10 These imaging studies have been used to evaluate and measure different anatomic areas; however, these modalities may be expensive to use or too complex or time-consuming to be clinically useful.
LIMITATIONS
There were several limitations to our study. One was the initial step of calibration using a ruler that was required to ensure correct area measurements even though this would not have changed the ratio of unoccupied area to the oral cavity. Another was the need to accurately demarcate the boundaries of the entire oral cavity and the teeth and tongue separately. Drawing the line between the tongue and the rest of the oral cavity (what is considered unoccupied area toward the pharynx) was the area that seemed most troublesome with researchers demarcating the structures. Except for one researcher who found the trackpad easier to use, we found that the computer mouse facilitated the drawing of perimeters around oral structures accurately. Our sample size was small and though we showed intra- and inter-reliability, a greater sample size would have been more meaningful statistically. Another concern is that ImageJ is limited currently in its application to airway assessment as it only operates on a desktop computer or laptop, and does not currently function efficiently through mobile devices. Additionally, we only examined the oral cavity and tongue, and did not take thyromental distance or neck range of motion into consideration with our digital imaging airway assessment.
CONCLUSIONS
In summary, our novel technique allowed for an alternative user-friendly, reliable analysis to accurately and quickly measure the size and shape of the tongue, the unoccupied area of the oral cavity, and the ratio of unoccupied area to the entire oral cavity. Our alternative precise, objective airway assessment had a high intra- and inter-rater reliability. With the advent of greater utilization of smartphones, future developments of this application seem prominent. It is possible that further studies using DI may correlate the ratio of the unoccupied area to the entire oral cavity with difficult airway management, the successful device used for intubation, and/or complications.
Acknowledgments
We wish to acknowledge the clinical research personnel who served as our subjects and Addie Larimore for editorial assistance.
Conflict of Interest/Disclosure
None of the authors has anything to disclose financial or otherwise.
No external sources of funding. Funded solely by the Department of Anesthesiology, Wake Forest School of Medicine.
Author Contributions
YB: design of study, manuscript preparation
KJ: data analysis, manuscript preparation
ZR: data analysis, manuscript preparation
PS: design of study
REFERENCES
- Mallampati SR. Clinical sign to predict difficult tracheal intubation (hypothesis). Can Anaesth Soc J. 1983;30:316-7.
- Khan ZH, Kashfi A, Ebrahimkhani E. A comparison of the upper lip bite test (a simple new technique) with modified Mallampati classification in predicting difficulty in endotracheal intubation: a prospective blinded study. Anesth Analg. 2003;96:595-9.
- Yentis SM. Predicting difficult intubation–worthwhile exercise or pointless ritual? Anaesthesia. 2002;57:105-9.
- Shiga T, Wajima Z, Inoue T, Sakamoto A. Predicting difficult intubation in apparently normal patients: a meta-analysis of bedside screening test performance. Anesthesiology. 2005;103:429-37.
- Karkouti K, Rose DK, Ferris LE, Wigglesworth DF, Meisami-Fard T, Lee H. Inter-observer reliability of ten tests used for predicting difficult tracheal intubation. Can J Anaesth. 1996;43:554-9.
- Rosenstock C, Gillesberg I, Gätke MR, Levin D, Kristensen MS, Rasmussen LS. Inter-observer agreement of tests used for prediction of difficult laryngoscopy/tracheal intubation. Acta Anaesthesiol Scand. 2005;49:1057-62.
- Gupta K, Gupta PK. Assessment of difficult laryngoscopy by electronically measured maxillo-pharyngeal angle on lateral cervical radiograph: A prospective study. Saudi J Anaesth. 2010;4:158-62.
- Mallampati SR, Gatt SP, Gugino LD, Desai SP, Waraksa B, Freiberger D, et al. A clinical sign to predict difficult tracheal intubation: a prospective study. Can Anaesth Soc J. 1985;32:429-34.
- Nashi N, Kang S, Barkdull GC, Lucas J, Davidson TM. Lingual fat at autopsy. Laryngoscope. 2007;117:1467-73.
- Adamus M, Fritscherova S, Hrabalek L, Gabrhelik T, Zapletalova J, Janout V. Mallampati test as a predictor of laryngoscopic view. Biomed Pap Med Fac Univ Palacky Olomouc Czech Repub. 2010;154:339-43.
- Riley Z, Santago P, Bryan Y. Digital imaging for objective airway assessments shows high inter-rater reliability amongst anesthesiology researchers. Poster #53. Presented at the 2015 State of North Carolina Undergraduate Research and Creativity Symposium. November 14, 2015. Available at: http://sncurcs.org/2015-sncurcs-digital-program/. Accessed February 29, 2016.
- Connor CW, Segal S. Accurate classification of difficult intubation by computerized facial analysis. Anesth Analg. 2011;112:84-93.
- Naguib M, Malabarey T, AlSatli RA, Al Damegh S, Samarkandi AH. Predictive models for difficult laryngoscopy and intubation. A clinical, radiologic and three-dimensional computer imaging study. Can J Anaesth. 1999;46:748-59.
- Wojtczak JA. Submandibular sonography: assessment of hyomental distances and ratio, tongue size, and floor of the mouth musculature using portable sonography. J Ultrasound Med. 2012;31:523-8.
Figure Legends
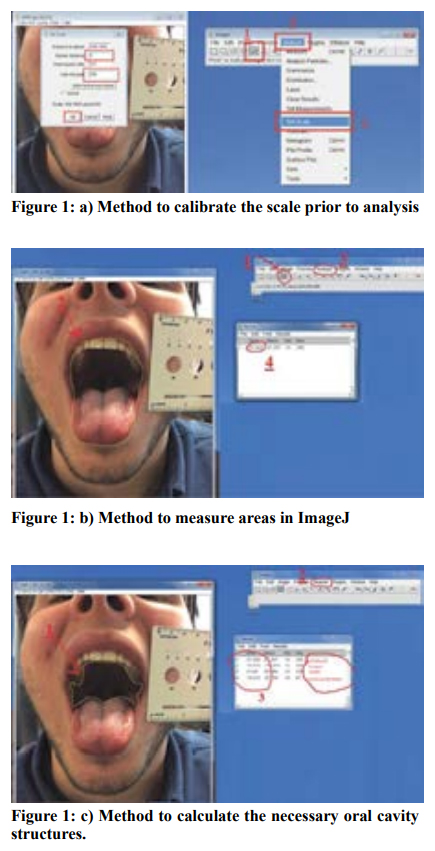
Figure 1: a) Method to calibrate the scale prior to analysis
- b) Method to measure areas in ImageJ
- c) Method to calculate the necessary oral cavity structures.