
Logan Danielson
St. John’s Hospital and Medical Center, Detroit, Michigan (USA)
St. George’s School of Medicine, Grenada, West Indies
Correspondence: Logan Danielson, St. John’s Hospital and Medical Center, Detroit, Michigan (USA);
E-mail: logandanielson@gmail.com
SUMMARY
Designing a research study entails a detailed understanding of many topics. In this article, we will continue to build upon our stepwise framework for conducting and publishing research. These steps will be punctuated with topics that describe the additional knowledge necessary for understanding how to design a research study. As these topics can be quite broad, the information presented has been curated to provide the reader with the general idea, while clearing up popular misconceptions and elucidating how the reader might deepen their knowledge, if they want additional information. This article will conclude with a discussion on hypothesis testing. The process of designing a research study will be further discussed in the next article of this series.
Keywords: Clinical Research; Research study design; Evidence-based Medicine
Citation: Danielson L. Fundamentals of clinical research. 2: Designing a research study. Anaesth Pain & Intensive Care 2018;22(1):131-138
SERIES INTRODUCTION
This series of articles is meant to provide the reader with a framework from which to efficiently conduct research. The content presented is intended to be of benefit to both junior and senior researchers, as a firm understanding of the fundamentals is always essential to performing at the highest level.
The Importance of Clinical Research
Danielson L. Anaesth Pain & Intensive Care 2017;21(3):289-291
Fundamentals of clinical research 1: Selection of a suitable and workable research proposal
Danielson L. Anaesth Pain & Intensive Care 2017;21(4):485-488
Fundamentals of clinical research 2: Designing a research study Danielson L. Anaesth Pain & Intensive Care 2018;22(1):131-138
Fundamentals of clinical research 3: Designing a research study (continued)
Tentative – Expected publication date is June 2018
Fundamentals of clinical research 4: Writing and publishing an original research article
Tentative – Expected publication date is September 2018
RESEARCH METHODS
In the first part of this series, we discussed the importance of clinical research and concluded that the importance came from going about it properly. I believe that experts of any field would agree that the utilization of a method, whether it be one they were taught or one that they themselves developed, is what leads to their professional success, and so, today we will start our discussion on research methods. For purposes of scope, we will define research methods as: “specific techniques for collecting and analyzing data in such a way that you can come to reliable conclusions…”1 I like this definition. It delineates our objective by directing our attention to the collection & analysis of data and it reminds us of our goal of producing reliable conclusions. Now, at this point, we’ve completed our Step 0, the process of developing a research question, so we can move on to Step 1.
Step 1: Define your null hypothesis
When you design your research question and perform a literature review, you should have an idea of what the answer to your question will be. This answer is your hypothesis. It is, alas, impossible to prove a hypothesis as it can always be argued that one simply did not find the evidence to disprove it. For this reason, we instead direct our efforts at something which is possible, i.e. we seek to disprove something and from that we infer that our hypothesis is likely correct. The thing that we seek to disprove is the null hypothesis. It is important that the null hypothesis be exact and well-defined, but in general, the null hypothesis can be thought to make the opposite claim of our hypothesis. If our hypothesis claims a difference exists, then the null hypothesis claims that no difference exists and, if our hypothesis claims no difference exists, then the null hypothesis claims that a difference does exist.
The original description of the null hypothesis was reported by Ronald Fisher, the inventor of Fisher’s exact test, in The Design of Experiments.2 It’s a cute story and serves as a fine example of designing an experiment so I’ll recount it here. The story goes that Ronald Fisher had a lady friend that claimed to be able to taste the difference between tea made by adding milk to tea and that made by adding tea to milk. This claim led to a social bet and the creation of an experiment. The hypothesis was that the woman would be able to tell the difference between the teas and the null hypothesis claimed that the woman had no ability to tell the difference. The experimental setup entailed that the woman be given 4 cups of tea of both varieties. To be able to reject the null hypothesis, she would have to correctly identify all 4 cups of tea of either type. Humorously, the story goes that the woman did correctly identify the teas and this led Fisher to reject his null hypothesis and discuss the importance of more testing to provide more conclusive evidence.3
Step 2: Determine what type of study is needed
The determination of the appropriate type of study to perform needs to be based on what is scientifically appropriate as well as what is feasible in the researcher’s context. This is not to say that subpar studies should be performed, instead the point is to plan a study that can be successful. Some factors that could preclude the success of a particular type of study include: lack of the available financial resources, lack of staff, and infeasibility due to organizational structure, number of patients required, or proposed timeframe.4
TYPES OF RESEARCH STUDIES
Clinical research studies can be thought of belonging to one of two groups: treatment and observational. The treatment studies include: randomized controlled trials, adaptive clinical trials and nonrandomized trials. The observational studies can be broken down into two subgroups: descriptive and analytical. The descriptive observational studies include: case reports, case series, and population studies. The analytical observational studies include: cohort studies, case-control studies, cross-sectional studies and ecological studies.
Randomized controlled trials
Randomized controlled trials (RCT) are the appropriate study to use to correlate a treatment, intervention or preventative measure to a given outcome. The study will feature at least 2 groups of patients. One group will serve as a control group and the other groups will account for the different proposed actions. The assignment of a patient to a group is done randomly so as to not add bias to the study. There are different methods for randomization, these include: simple randomization, randomization of blocks, randomization of pairs, crossover design and N of 1 trials. To reduce bias in results, RCTs are blinded, i.e. the people involved with the study do not know which patients are receiving a given intervention. These people include: the researcher that randomly assigns patients to groups, the patient themselves, the study investigators carrying out the study and the researcher that analyzes and assesses the data. Not all RCTs can blind all 4 of these groups, but fully blinding the study is preferred as it minimizes potential bias.
RCTs can be said to determine a treatment’s efficacy or its effectiveness, this difference is determined in part by the method used to analyze the study’s results. After randomization, patients may drop out of the study, switch treatment groups midway, receive additional treatments or be noncompliant with the study’s protocol. This problem gives the researcher two choices, analyze by the “Intention to Treat” method or the “Explanatory” method. The “Intention to Treat” method analyzes patients based on what group they were assigned to. The “Explanatory” method analyzes patients based on which treatment they actually received. An RCT is said to assess efficacy if it determines whether treatment works in an ideal setting, i.e. the study excludes certain comorbidities, occurs over a short time and the participants are highly selected. Efficacy can be assessed with either an “Intention to Treat” or “Explanatory” method of analysis. An RCT is said to assess effectiveness if it determines whether treatment works in a real-world setting, i.e. the study occurs over a longer period of time and uses a larger sample size. Effectiveness should only be assessed with the “Intention to Treat” method of analysis.
RCTs are extolled in the research world due to their ability to lend evidence to proving causation, instead of simply association. If you spend enough time reading articles like this one, then you’re bound to see a “quality of evidence” pyramid with RCTs at the top of the pyramid or just under meta-analyses and systematic reviews. I wouldn’t argue with this placement, but I would suggest making sure that one’s choice of study design be the one that best suits their specific research question and context, not simply that which is most venerated. Readers interested in real world examples of RCTs not giving the best evidence are directed to this article by Tom Frieden.5
Adaptive clinical trials
Adaptive clinical trials have the goal of speeding up the process of identifying interventions that have a therapeutic effect as well as to identify which patient populations are best suited for a given intervention. Their study protocol specifies the adaptation schedule and processes, thus dictating how the study can change when outcomes are observed during interim data reviews. The parameters that can change include the drugs used in the study & their respective dosages as well as the study’s patient selection criteria & sample size.
Nonrandomized trials
Nonrandomized trials are also known as quasi-experiments. The lack of randomization in these studies leads to concerns over their internal validity, but they can be useful when it is not possible or feasible to randomly assign study participants to a group. This can occur when assessing the effect of public policy changes as well as large scale health or educational interventions. Likewise, this also includes studies that group patients by life events, like being in a car accident, as one can’t ethically assign a patient to being in a car accident.
Case reports, case series, and population studies
Case reports, case series, and population studies are similar. Case reports describe the experience of a single patient with a known exposure. Case series describe the experience of a group of patients with a known exposure. Population studies describe a large group of individuals that share a common characteristic, like age, gender, or health status. All 3 of these studies are purely descriptive, they lack control groups, do not involve hypothesis testing, and they cannot be used to determine treatment effect.
Cohort studies
Cohort studies exist in 3 forms: prospective cohort studies, retrospective cohort studies & time series studies. The prospective cohort studies and retrospective cohort studies are both longitudinal cohort studies that compare the effect of an exposure or intervention on the incidence of an outcome. The prospective cohort studies are said to “look forward,” enrolling patients unaffected by an outcome and observing them, over a period of years, for development of that outcome with respect to a certain exposure or intervention. Whereas, retrospective cohort studies are said to “look back,” typically requiring a chart review to collect the data to be analyzed. Retrospective cohort studies are subjected to more types of bias than their prospective counterparts, but they have the advantages of taking less time to complete, being less expensive and having the ability to address rare diseases. Time series studies in medicine are most frequently used to forecast mortality, using data taken at discrete, evenly distributed time points. The data from a cohort study can be described as a relative risk or an odds ratio.
Case-control studies
Case-control studies enrolled two groups that differ in an outcome, that are then compared based on their exposure or intervention history. This should be thought of in contrast to the retrospective cohort study: case-control studies know the outcome and relate that to the exposure or intervention history, whereas retrospective cohort studies know the exposure or intervention history and relate that to the outcome. Each case patient in the study is matched to 1 to 4 control patients. The control patients are similar to their case patient in all respects, except for their lack of the disease of interest. Case-control studies are of particular use in the study of rare diseases as well as a preliminary study, when little is known about the association between the exposure and outcome of interest. As the matching of controls to cases affects the perceived disease “incidence” in the study, only odds ratios can be used to describe the data.
Cross-sectional studies
Cross-sectional studies are studies of prevalence, not incidence, they analyze data of a group (potentially, an entire population) at a specific point in time. They can be used to describe odds ratio, as well as absolute and relative risks. It should be noted that the only patients “prevalent” at the time of the study are those that have yet to succumb to their disease and this fact should influence one’s interpretation of the results. Cross-sectional studies should not be used for rare diseases and they cannot answer questions of causality.
Ecological studies
Ecological studies in medicine are studies of health outcomes based on groups characterized by either their geographic or temporal location. While individuals are the source of data, the data is analyzed at the level of comparing groups.
Table 1: Examples of different types of studies
| Type of Study | Examples |
| Randomized controlled trial | · Federico P, Annalisa F, Guiseppe C, et al. Coagulation management in patients undergoing open heart surgery by activated clotting time and whole blood heparin concentration. Perfusion. 2006;21(5):285–90. [PubMed]
· Church C, Price C, Pandyan A, et al. Randomized Controlled Trial to Evaluate the Effect of Surface Neuromuscular Electrical Stimulation to the Shoulder After Acute Stroke. Stroke. 2006;37(12):2995–3001.[PubMed] |
| Adaptive clinical trial | · Lewis RJ, Angus DC, Laterre PF, Kjølbye AL, van der Meulen E, Blemings A, et al. Rationale and Design of an Adaptive Phase 2b/3 Clinical Trial of Selepressin for Adults in Septic Shock. Selepressin Evaluation Programme for Sepsis-induced Shock-Adaptive Clinical Trial. Ann Am Thorac Soc. 2018 Feb;15(2):250-257. |
| Nonrandomized trial | · Schwartz RP, Hamre R, Dietz, WH, et al. Office-Based Motivational Interviewing to Prevent Childhood Obesity. Arch Pediatr Adolesc Med. 2007;161:495-501. |
| Case report | · Chang TB, Huh J. Delayed neuromuscular recovery after use of sugammadex in a patient with amyotrophic lateral sclerosis: a case report. Anaesth Pain & Intensive Care 2017;21(4):475-478
· Jadoon H, Khan TH, Ahmed F, Tasneem S. Malignant hyperthermia: survival without dantrolene – a case report. Anaesth Pain & Intensive Care 2016;20(2):236-239 |
| Case series | · Hameed F, Raza A, Saleem J, Taqi A. VATS without general anesthesia: initial experience of 18 cases. Anaesth Pain & Intensive Care. 2016;20 Suppl 1:S150-S153
· Iyilikci L, Ozbilgin S, Akan M, Ozkardesler S, Duru LS. Sugammadex use in liver transplantation: a case series and literature review. Anaesth Pain & Intensive Care 2015;19(3):376-379 |
| Population study | · Hourani LL, Williams J, Lattimore PK, Morgan JK, Hopkinson SG, Jenkins L, et al. Workplace victimization risk and protective factors for suicidal behavior among active duty military personnel. J Affect Disord. 2018 Apr 22;236:45-51. |
| Prospective cohort study | · Chitmulwar S, Deshpande C. Comparison of insertion characteristics between LMA- Supreme and Laryngeal tube with suction in patients undergoing short duration surgery: a prospective analytical cohort study. Anaesth Pain & Intensive Care 2017;21(2):187-193
· Khatri RK, Sethi P, Ujawal S. Perioperative hemodynamic response and vasopressor requirement during spinal anesthesia for cesarean section in healthy and severe preeclamptic parturients: a prospective cohort comparison. Anaesth Pain & Intensive Care 2014;18(2):152-56 |
| Retrospective cohort study | · Yapar N, Akan M, Avkan-Oguz V, Ergon CM, Hancer M, Doluca M. Risk factors, incidence and outcome of candidemia in a Turkish intensive care unit: a five-year retrospective cohort study. Anaesth Pain & Intensive Care 2014;18(3):265-71 |
| Time series study | · Saldiva PHN, Pope III CA, Schwartz J, Dockery DW, Lichtenfels AJ, Salge JM, et al. Air Pollution and Mortality in Elderly People: A Time-Series Study in Sao Paulo, Brazil. Archives of Environmental Health 2010;50:2:159-163 |
| Case-control study | · Smedby KE, Hjalgrim H, Askling J, Chang ET, Gregersen H, Porwit-MacDonald A, et al. Autoimmune and chronic inflammatory disorders and risk of non-Hodgkin lymphoma by subtype. J Natl Cancer Inst. 2006 Jan 4;98(1):51-60. |
| Cross-sectional study | · Macedo E, Cerdá J, Hingorani S, Hou J, Bagga A, Burdmann EA, et al. Recognition and management of acute kidney injury in children: The ISN 0by25 Global Snapshot study. PLoS One. 2018 May 1;13(5):e0196586.
· Kakagia DD, Zapandioti P, Trypsiannis G, Grekou AN, Tsoutsos D. Sentinel lymph node metastasis in primary cutaneous basosquamous carcinoma. A cross-sectional study. J Surg Oncol. 2018 May 1. doi: 10.1002/jso.25062. |
| Ecological study | · Cutts BB, Greenlee AJ, Prochaska NK, Chantrill CV, Contractor AB, Wilhoit JM, et al. Is a clean river fun for all? Recognizing social vulnerability in watershed planning. PLoS One. 2018 May 1;13(5):e0196416. |
PRIMARY AND SECONDARY DATA
Data can be thought of being either primary data or secondary data, the difference is their source. Primary data is that which has been observed, experienced or recorded by the researcher. Secondary data comes from a written source that of which is meant to serve as a record or interpretation of the primary data, like an EMR or paper chart. The significance of this difference is that secondary data is more likely to have bias as it wasn’t created specifically for the study.
PRIMARY AND SECONDARY ENDPOINTS
Primary & secondary endpoints are also referred to as outcomes. The primary endpoint of a clinical trial is the outcome for which the study is powered to detect and about which the study participants are randomized. Primary endpoints cover outcomes that have a clinical meaning, like survival or response duration. Secondary endpoints are also referred to as surrogate endpoints. A trial may not be sufficiently powered to detect a statistically significant effect for secondary endpoints and they typically refer to outcomes that are easier to measure but harder to correlate to a clinical outcome, this includes lab results and physical signs that are believed to substitute for primary endpoints.
TYPES OF VARIABLES
The data you collect for your study can be referred to as a variable. There are multiple types of variables and understanding these types is crucial to choosing the appropriate statistical tests to use with them. Categorical variables are those that exist in 2 or more mutually exclusive categories that of which lack an intrinsic ordering. Classically speaking, gender is a categorical variable of two groups without ordering. Categorical variables of two groups are sometimes referred to as binary variables. Categorical variables can also be referred to as nominal variables. Ordinal variables are variables of 2 or more categories with an intrinsic ordering, e.g. socioeconomic status or educational achievement. It is important to note that ordinal variables cannot be logically subtracted from one another as the “scale” of the variable is not necessary continuous. This brings us to the next type of variable, the continuous variable. Continuous variables exist in two forms: interval variables and ratios. An interval variable is one where increments are known, consistent, and measurable, hence they are ordered and the difference between two interval variables is meaningful. What interval variables lack is a true “zero-point,” for this reason they cannot be used to calculate a ratio. An example of an interval variable is a temperature in degrees Celsius. Ratio variables are like interval variables except they have a meaningful zero point, examples include: height and weight.
THE PURPOSE OF STATISTICS
In any study, we use a sample of a population to draw inferences about that whole population. While we would like to know the characteristics of the whole population, we can only study a sample of it, thus the values calculated in our study represent our sample, not the population. With the use of statistics, we can determine how well our sample’s characteristics approximates the entire population and thus how well our study’s inferences can be generalized to the entire population. When a number summarizes an entire population, it is called a parameter, if the same number summarizes a sample of that population, then it is referred to as a statistic.
The distribution of data
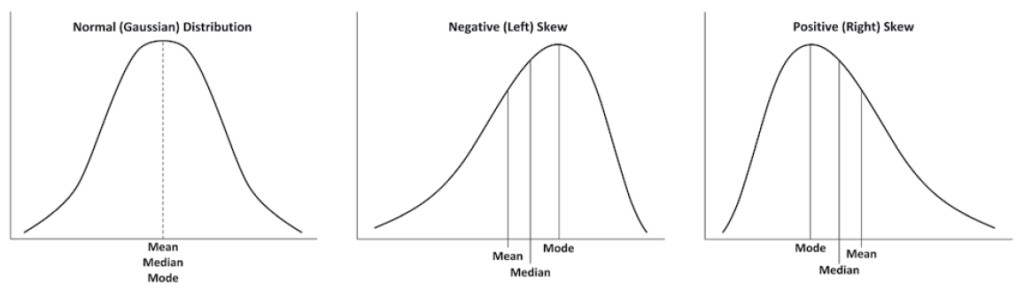
The mean, median and mode are concepts taught at a young age, yet a subtlety to their significance is lost by teaching them so early. The mean is an exact average of the data in the set and it is affected by outliers. The median and mode are both approximations of the average value of the data in a set and they are less affected by outliers in comparison to the mean. The comparison of these values provides information about how a given data set is distributed.
The normal distribution is the Gaussian distribution. It is symmetric, and resembles a bell, hence its other name: a bell curve. Data with a normal distribution features a mean, mode and median that are roughly equivalent. Data that is negatively skewed features a median greater than the mean. Data that is positively skewed features a mean that is greater than the median.
Figure 1: Data distribution and Skew. Modified from a figure created by Walliman.1
The standard deviation is a measure that describes how data is distributed about the mean. One can calculate a standard deviation for any set of data, but the standard deviation has the most meaning when it is calculated from data that fits a normal or near normal distribution. Considering your data’s type of distribution is important for determining what statistical tests are appropriate for it. Data that lacks a normal distribution must either be analyzed with a non-parametric test or transformed via some function to attain a normal distribution prior to analysis with a parametric test.
Estimating a population parameter
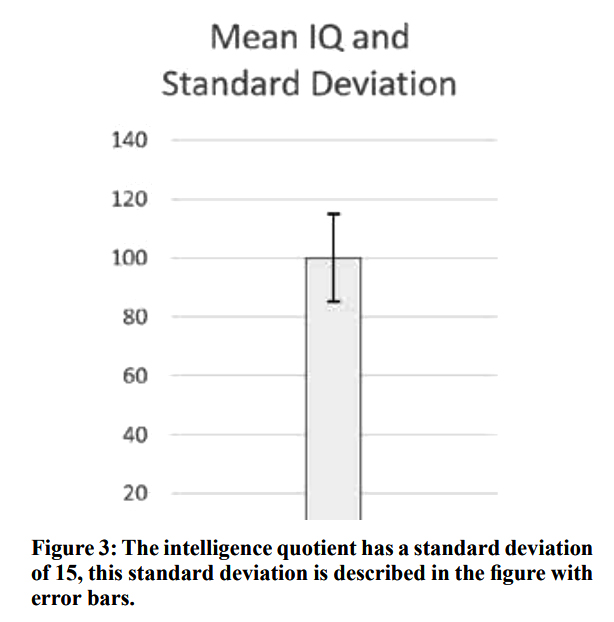
Standard errors can be calculated for any descriptive statistic. Standard errors calculated for the sample mean are referred to as Standard Errors of the Mean (SEM). The standard error is the standard deviation of the error of a calculated statistic. Remember, we strive to make inferences about a population, but our studies are conducted on samples of that population and the process of using a subset of the population induces a random error. The standard error represents a method to quantify how close our statistic is likely to be to the parameter that we are trying to estimate. The “likely to be” of the previous sentence is important, it is there as a reminder that we can calculate a statistic and its standard error, but we still do not truly know what the parameter we are estimating truly is, we just identify an area that it is more likely to be. Some confusion can arise from the fact that the standard deviation is a part of the calculation of the standard error, so I’ll attempt to clarify it: the standard error of the sample mean represents a measure of how far a sample mean is likely to be from the true population mean, whereas the standard deviation of a sample represents a measure of how far an individual data point is likely to be from the sample mean—in other words, the standard error attempts to describe the population, whereas the standard deviation describes the sample. Understanding this difference is important as both statistics are frequently shown as error bars on a graph, as demonstrated in figures 3 and 4.
Figure 2:
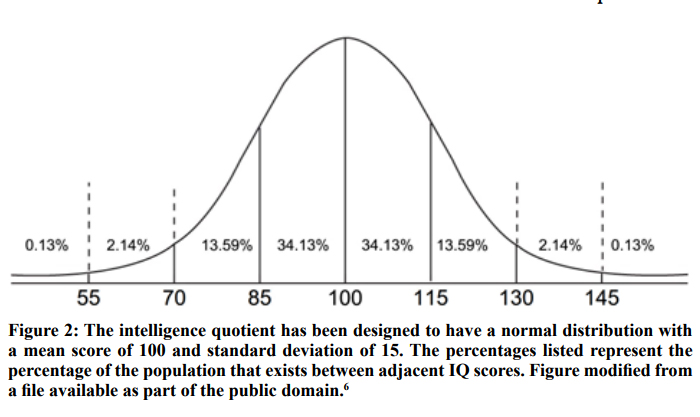
Figure 3:
Confidence Intervals can be calculated from samples or repeated samples. While many statistics are meant to provide point estimates of a population parameter, confidence intervals provide a range of values that act as estimates of the population parameter. The confidence interval we state may or may not contain the true population parameter, as the interval is based on randomly sampled data and is thus subject to random sampling error. The upper and lower bounds of the confidence interval value of the sample mean are derived by taking the sample mean and adding or subtracting “z” multiplied by the standard error of the mean, respectively, where the value of “z” is determined by the chosen confidence level. The value of the confidence level describes the reliability of the procedure we have used to generate our confidence interval. This description is subtly different from saying that there is a particular level of chance that the confidence interval includes the population parameter. To clarify why the latter statement is inappropriate, we can envision flipping a coin, where there’s a 50% chance it will land heads up and 50% chance it will land heads down. Prior to flipping the coin, these probabilities hold true, but once the coin lands, it must be either 100% heads up or 100% heads down. Likewise, once the confidence interval has been created, it either includes or excludes the population mean, while we don’t know which it is, it must be one of the two options. Point being, the probability stated as a confidence level reflects a characteristic of the process of its creation, not that of the result. On a less pedantic note, the confidence interval, being derived from the standard error, provides information about the population parameter, not the distribution of the sample data.
In Figure 4, the x axis is meant to signify the population mean and each diamond represents the sample mean calculated by a group of researchers. Each sample mean is surrounded by error bars that represent the 95% confidence interval of the mean. Of note, one of the twenty studies does not contain the population mean within its confidence interval.
Figure 4: The 95% confidence intervals of twenty studies
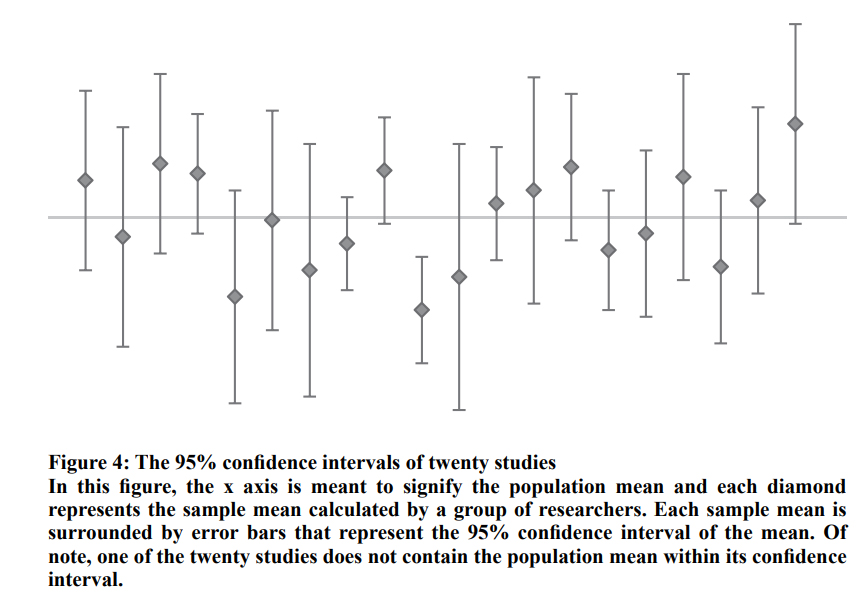
Table 2: Two-sided z value to be used for the calculation of a confidence interval at a given confidence level.
| Confidence level | Two-sided z values |
| 99% | 2.576 |
| 98% | 2.326 |
| 95% | 1.96 |
| 90% | 1.645 |
Hypothesis testing
Hypothesis testing is the basis of modern clinical research. With this approach, we say that we can reject our null hypothesis when our test statistic is below a certain cut-off. In medicine, this cut-off, known as the p value, is typically equal to 0.05. And some in the medical research field are trying to get the standard p value reduced to 0.005.7 Other fields are known to use much more stringent p values, for example, nuclear physicists use p values near 0.000001. It should be noted that the reason some fields feature incredibly small standard p values is that they can more easily repeat their experiments to get more data and generate smaller confidence intervals. Regardless, you should choose the p value that is most conducive to your study’s design and objective, not simply assume that the p value is always equivalent to 0.05.
Hypothesis testing can be said to operate on an “Innocent until proven guilty” basis. By this, I mean that failing to reject a null hypothesis proves nothing. When one has a test statistic below the p value, they can reject their null hypothesis, and conclude that their hypothesis is likely right, but if the test statistic is above the p value then the null hypothesis cannot be rejected and the only conclusion to be made is that no conclusion can be drawn, i.e. the failure to reject the null hypothesis does not prove the null hypothesis. This is important, so I’m going to say it again: the failure to reject the null hypothesis does not prove the null hypothesis. Researchers find difficulty with this concept when no statistically significant difference is found between groups because they want to conclude from this that the groups are equivalent, when in fact, they can’t because they failed to reject their null hypothesis and thus can’t prove anything. For those having trouble with this concept, imagine 2 people playing a game where one person guesses the number the other is thinking of, if they hinted that their number is not negative, one could conclude that their number must be positive, but that would be an incorrect because a non-negative number could be positive or it could be zero. This fact is the reason that a different set of statistical tests are used for trying to prove that groups are equivalent as opposed to the more common goal of proving groups as being different.\
To be continued
The next part of this series will continue the discussion regarding the design of a research study. It will describe more of the foundations of statistics and will feature a lengthy discussion on different statistical tests and when they should be used. This subsequent article will conclude with a discourse on the important topic of research ethics.
Conflict of interest: Nil declared by the author.
REFERENCES
- Walliman N. Research methods: the basics. London: Routledge; 2011.
- Fisher RA. The design of experiments. 9th ed. New York: Macmillan Pub Co; 1971.
- Salsburg D. The lady tasting tea: how statistics revolutionized science in the twentieth century. New York: A.W.H. Freeman/Holt Paperbacks; 2002.
- Röhrig B, du Prel JB, Wachtlin D, Blettner M. Types of Study in Medical Research; Part 3 of a Series on Evaluation of Scientific Publications. Dtsch Arztebl Int. 2009 Apr10;106(15):262–268.[Free full text] doi: 10.3238/arztebl.2009.0262\
- Why the ‘gold standard’ of medical research is no longer enough [Internet]. STAT. 2017 [cited 2018 Feb 17]. Available from:https://www.statnews.com/2017/08/02/randomized-controlled-trials-medicalresearch/
- PR and NCE.gif. 2006. [Public domain]
- Benjamin DJ, Berger JO, Johannesson M, Nosek BA, Wagenmakers EJ, Berk R, et al. Redefine statistical significance. Nature Human Behaviour [Internet]. 2017 Sep1;(2):6–10. Available from: https://www.nature.com/articles/s41562-017-0189-z[Free full text]
