
Mamata Pandey, PhD, Kieran Johnson, BSc. (Hons), Muhammad A. Siddiqui, MBBS, MSc, PhD
Mamata Pandey, PhD
Department of Research
Saskatchewan Health Authority
Regina, SK, (Canada)
Kieran Johnson, BSc. (Hons)
University of Saskatchewan
22 Culliton Crescent
Regina, SK, (Canada)
Muhammad A. Siddiqui, MBBS, MSc, PhD
Department of Research
Saskatchewan Health Authority
Regina, SK, (Canada)
Email: muhammad.siddiqui@saskhealthauthority.ca
Correspondence: Muhammad A Siddiqui, MBBS, MSc, PhD
Department of Research
Saskatchewan Health Authority
Regina, SK, (Canada)
Email: muhammad.siddiqui@saskhealthauthority.ca
ABSTRACT
Purpose: The objective of the study was to examine choice of anesthesia for total hip arthroplasty (THA) and total knee arthroplasty (TKA) in different provinces of Canada over a five-year period.
Methodology: In a retrospective, cross-sectional study, national data for patients undergoing THAs and TKAs between 1st April 2011 and 31st March 2016 was examined. The primary outcome was the anesthetic type used in the surgery, which was categorized as general, spinal, combined, or ‘other’. Total number and percentage of surgeries carried out using each anesthetic type were calculated per fiscal year, in non-teaching and TIs, in each Canadian province and territories, exclusive of Québec. Non-parametric statistics (Pearson Chi square tests) were used to compare the choice of anesthetic type by fiscal year and institution type.
Results: During the study period, neuraxial anesthesia (NA) was used for 74.7% of all THAs and 80.3% of all TKAs nationwide. In NTIs, 76.2% of THAs and 80.5% of TKAs were carried out with NA. This trend was similar to that within teaching hospitals, where 73.1% of THAs and 80.6% of TKAs were carried out with NA. Interprovincial comparisons demonstrated a greater preference for NA for both THAs and TKAs in majority of the provinces. There were no significant differences in anesthetic choice between teaching and NTIs.
Conclusion: Neuraxial anesthesia was the anesthesia of choice for THA and TKA during the entire study period in Canada, both in teaching and non-teaching institutions. During the study period, a majority of provinces showed a trend of increasing use of neuraxial anesthesia for both THA and TKA, with few exceptions.
Key words: Anesthesia; Neuraxial anesthesia; Total hip arthroplasty; Total knee arthroplasty; Canada; Teaching institutions; Non-teaching institutions
Citation: Pandey M, Johnson K, Siddiqui MA. Anesthetic practice and pattern for total hip and knee replacement in Canada: a 5 year cross-sectional study. Anaesth pain & intensive care 2019;23(3):301-310
Abbreviations: THA -Total hip arthroplasty, TKA- Total knee arthroplasty, GA – General anesthesia, TI – Teaching institution, NTI- Non-teaching institution
Received: 2April 2019, Reviewed: 13 September 2019, Revised: 22 October 2019, Accepted: 22 October 2019
INTRODUCTION
Total hip arthroplasty (THA) and total knee arthroplasty (TKA) are common surgical operations requiring high quality anesthesia and post-operative analgesia to provide optimal patient care and to enable effective rehabilitation. Neuraxial anesthesia (NA = spinal and epidural) has gained acceptance as the optimal anesthetic choice over general anesthesia (GA) in these operations. NA is associated with a lower 30-day mortality rate after THA/TKA and a more favorable 30-day complication profile.1,2 NA for THA and TKA has also been shown to offer short-term benefits such as lower incidences of wound infection, transfusion, better pain control post-operatively, and possible reductions in length of stay,3,4 and in-hospital falls over GA.5,6 NA is also observed to reduce combined major complications such as cardiac complications; pulmonary complications, deep venous thrombosis; cerebrovascular accidents; infections; and acute renal failure, and gastrointestinal complications by a minimum of 11%.5 These benefits were further amplified for older patients and those with multiple comorbidities.3,5 Further, a high risk of thirty day complication was observed for patients receiving hip fracture surgery with GA compared to NA.7
Although research shows several benefits associated with NA, the Agency of Healthcare Research and Quality noted that it can sometimes take up to a decade or two to translate research findings into clinical practice.8 Despite the documented benefits of NA, in a sample of anesthetic practice for THAs and TKAs across the United States, GA accounted for 61.5% of THAs and 55.3% of TKAs.9 In addition, two thirds of total joint replacements were done under GA at teaching institutions (TIs) and surgery centers. In a recent cohort study carried out in Ontario, approximately 80% of patients undergoing joint replacement surgeries received NA, compared to 20% who received GA;1 however, pan-Canadian data on the topic is unavailable.
The primary objective of this study was to describe the use of different anesthesia types in Canada for THA and TKA over a five-year period (fiscal years).The second objective was to examine trends in choice of anesthesia type by year, by province, and between teaching and non-teaching institutions (NTIs). It was hypothesized that consistent with the study carried out in United States; overall, GA would be used more frequently than NA for THA and TKA. Further, a difference in anesthetic preferences between teaching and NTIs was expected.
METHODOLOGY
Study Design and Data Source:
Ethics approval for this study was obtained from the Regina Research Ethics Board, Saskatchewan Health Authority, Regina (REB14-92). A retrospective, cross-sectional study design was employed, spanning the period of 1st April 2011 to 31st March 2016 (i.e., 1st April 2011- 31st March 2012 to 1st April 2015 -31st March 2016). The Canadian Institute for Health Information (CIHI) provided aggregate-level data on the number of THA and TKA surgeries from all provinces and territories from the Decision Support Services database (DSS), excluding Quebec. Data from Quebec, reported to Hospital Morbidity Database, was not accessed due to logistical reasons. Patient-level data and admission level variables were not available. The Canadian Classification of Health Interventions (CCI) procedure codes and the mandatory attributes for THA and TKA do not differentiate between elective versus emergency surgery consequently it is possible that a proportions of the surgeries also include fractures.
Cohort:
Data from all individuals receiving a THA or TKA surgery in an acute inpatient facility during the study period was examined. This data captures both elective and urgent/emergent cases and is inclusive of newborns and deaths; however, it excludes stillbirths, cadaveric donations, interventions performed out of hospital, and interventions abandoned based on individual patients’ admission category.[1]
Teaching Institution (TI) was defined as a patient care organization with a publicly stated tripartite mandate of care, training, and research. They include research hospitals, regional health authorities, and their research institutes. They may be single or multi-site corporations.
Non-teaching Institution (NTI) was defined as patient care organization without a publicly stated tripartite mandate of care, training, and research. They include hospitals, regional health authorities, and their affiliated institutes. They may be single or multi-site corporations.
Outcomes:
The anesthetic type used in the surgery was the primary outcome variable and categorized as: (1) GA, (2) neuraxial anesthetics (spinal, epidural and combined spinal-epidural [CSE], the latter of which was added in FY 2015-16), (3) combined (general and spinal), and (4) others (consisting of other nerve block, monitored anesthetics care, local anesthesia, no anesthetics given with intervention, unknown, other anesthetics not listed and not administered or monitored by an anesthetist, not available, and cells that are suppressed in accordance with CIHI’s cell suppression practice as these cells contain counts of 1-4). Total numbers of THAs and TKAs carried out with each anesthetic type was grouped by years and by institution type TIs or non-teaching institution (NTI),10 within each province, excluding Quebec. The data was organized separately for THAs and TKAs. The Northwest Territories, Yukon, and Nunavut were combined under the category TE.
Statistical Analysis:
Descriptive statistics (category sums and percentages) were used to describe the anesthesia type selected for both types of surgical procedure. All cases were included in the analysis. Non-parametric statistics (Pearson’s Chi-square test) were used to measure the association between the independent variables (year, province, hospital teaching status) and choice of anesthesia type. Data were analyzed using the Statistical Package for Social Sciences (SPSS, version 22.0), Armonk, NY: IBM Corp. For all analyses, p < 0.05 was accepted as statistically significant. Relative risk (95% confidence intervals) was reported for significant interactions and the strength of association between variables (effect size) was represented as Cramer V.11 The value of Cramer’s V ranges from 0 to +1 inclusive, with effect sizes defined as small (0.1), medium (0.3), or large (0.5).12,13
Abbreviations used in this paper for the provinces of Canada are given with population in Appendix 1.
Missing data: In all tables and graphs N < 5 is replaced by “*” in keeping with CIHI data reporting regulations. In 462 THAs and 513 TKAs, the anesthesia type could not be determined as they represented cells less than five. Institution categorization was missing for five institutions. For 325 THAs and 373 TKAs, institution type could not be determined.
RESULTS
Out of 159 institutions included, 115 (72.3%) were NTI and 44 (27.7%) were TI. In the study period, 137,218 THAs and 204,671 TKAs were performed. In total, 78,139 THAs and 127,931 TKAs were performed in NTI compared to 58,754 THAs and 76,367 TKAs performed in TI.
Total-Hip Arthroplasty:
NA was most commonly used (N = 102,525; 74.7%) followed by GA (N = 28,703; 20.9%); combined (N = 5,112; 3.7%); and others (N = 878; 0.6%). Figure 1 indicates, NA use increased to 75.9% in 2015 (relative risk 0.97; 95% CI, 0.96 to 0.98) from 73.5% in 2011. The association between year and type of anesthesia was significant (p < 0.001, but small, Cramer’s V = 0.02).

Figure 1: Anesthetic practice for THA across Canada – 1st April 2011-31st March 2016 (N = 137218)
NA was most commonly used in both institutions (NNTI = 59,569; 76.2%; NTI = 42,956; 73.1%) followed by GA (NNTI = 15095; 19.3%; NTI = 13608; 23.2%), and combined (NNTI = 3278; 4.2%; NTI = 1834; 3.1%). The association between the institution type and type of anesthesia was significant
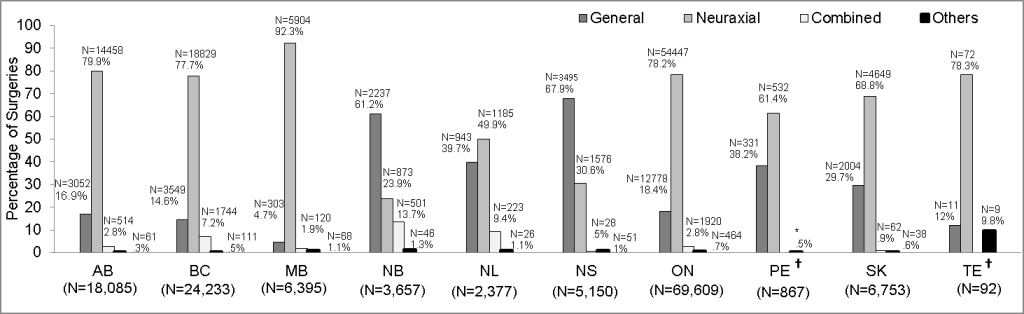
Figure 2: Comparison of anesthesia choice for THA in different provinces (N = 137218)
†Surgeries carried out with combined general and regional spinal/ epidural was not available for PE and TE
‡Year refers to Fiscal year in the graphs
*Actual N supressed
(p < 0.001, but small Cramer’s V = 0.05). In New Brunswick (NB; 61.2%) and Nova Scotia (NS; 67.9%) GA was preferred over NA (Figure 2).
As seen in Table 1, NA use increased in NS (22.1% in 2011 to 37% in 2015; relative risk, 0.6; 95% CI, 0.52 to 0.69). The association between year of surgery and type of anesthesia in NS was significant (p < 0.001; but small Cramer’s V = 0.2). NA increased in Manitoba (MB; 90.6% in 2011 to 92.7% in 2015; relative risk, 0.98; 95%CI, 0.97 to.99). The association between year and type of anesthesia in MB was significant (p < 0.03; but small Cramer’s V = 0.04).
Table 1: Anesthesia choice for THA in the provinces
| 2011 | 2012 | 2013 | 2014 | 2015 | ||
| AB | General | 625 (19.0) | 553 (16.0) | 610 (16.9) | 585 (15.5) | 679 (17.2) |
| Neuraxial | 2563 (77.7) | 2784 (80.7) | 2901 (80.2) | 3084 (81.6) | 3126 (79.4) | |
| Combined | 99 (3.0) | 106 (3.1) | 95 (2.6) | 91 (2.4) | 123 (3.1) | |
| Other | 10 (0.3) | 8 (0.2) | 11 (0.3) | 21 (0.6) | 11 (0.3) | |
| Total | 3297 (100) | 3451 (100) | 3617 (100) | 3781 (100) | 3939 (100) | |
| BC | General | 641 (14.2) | 618 (13.8) | 717 (15.4) | 754 (14.9) | 819 (14.9) |
| Neuraxial | 3487 (77.2) | 3504 (78.2) | 3551 (76.4) | 3941 (77.6) | 4346 (78.8) | |
| Combined | 375 (8.3) | 341 (7.6) | 340 (7.3) | 354 (7.0) | 334 (6.1) | |
| Others | 11 (0.2) | 17 (0.4) | 40 (0.9) | 28 (0.6) | 15 (0.3) | |
| Total | 4514 (100) | 4480 (100) | 4648 (100) | 5077 (100) | 5514 (100) | |
| MB | General | 56 (4.7) | 80 (6.9) | 56 (4.7) | 66 (4.6) | 45 (3.2) |
| Neuraxial | 1075 (90.6) | 1055 (90.4) | 1111 (93.0) | 1328 (92.7) | 1335 (94.5) | |
| Combined | 32 (2.7) | 22 (1.9) | 19 (1.6) | 28 (2.0) | 19 (1.3) | |
| Others | 24 (2.0) | 10 (0.9) | 9 (0.8) | 11 (0.8) | 14 (1.0) | |
| Total | 1187 (100) | 1167 (100) | 1195 (100) | 1433 (100) | 1413 (100) | |
| NB | General | 338 (61.3) | 343 (71.9) | 488 (60.2) | 492 (58.9) | 576 (58.7) |
| Neuraxial | 126 (22.9) | 73 (15.3) | 198 (24.4) | 217 (26.0) | 259 (26.4) | |
| Combined | 80 (14.5) | 54 (11.3) | 108 (13.3) | 120 (14.4) | 139 (14.2) | |
| Others | 7 (1.3) | 7 (1.5) | 17 (2.1) | 7 (0.8) | 8 (0.8) | |
| Total | 551 (100) | 477 (100) | 811 (100) | 836 (100) | 982 (100) | |
| NL | General | 190 (45.3) | 125 (32.9) | 198 (40.0) | 198 (39.4) | 232 (40.0) |
| Neuraxial | 186 (44.4) | 203 (53.4) | 245 (49.5) | 253 (50.3) | 298 (51.4) | |
| Combined | 38 (9.1) | 48 (12.6) | 46 (9.3) | 46 (9.1) | 45 (7.8) | |
| Others | 5 (1.2) | * (1.1) | 6 (1.2) | 6 (1.2) | 5 (0.9) | |
| Total | 419 (100) | 380 (100) | 495 (100) | 503 (100) | 580 (100) | |
| NS | General | 715 (75.8) | 675 (72.2) | 764 (68.9) | 664 (62.3) | 677 (61.7) |
| Neuraxial | 208 (22.1) | 244 (26.1) | 330 (29.8) | 388 (36.4) | 406 (37.0) | |
| Combined | 8 (0.8) | 6 (0.6) | 0 (0.0) | 9 (0.8) | 5 (0.5) | |
| Others | 12 (1.3) | 10 (1.1) | 15 (1.4) | 5 (0.5) | 9 (0.8) | |
| Total | 943 (100) | 935 (100) | 1109 (100) | 1066 (100) | 1097 (100) | |
| ON | General | 2440 (19.7) | 2340 (18.7) | 2639 (18.7) | 2756 (18.5) | 2603 (16.6) |
| Neuraxial | 9517 (76.9) | 9727 (77.7) | 11067 (78.2) | 11598 (78.0) | 12538 (79.8) | |
| Combined | 346 (2.8) | 357 (2.9) | 358 (2.5) | 407 (2.7) | 452 (2.9) | |
| Others | 68 (0.5) | 95 (0.8) | 80 (0.6) | 107 (0.7) | 114 (0.7) | |
| Total | 12371 (100) | 12519 (100) | 14144 (100) | 14868 (100) | 15707 (100) | |
| PE† | General | 69 (50.7) | 71 (43.6) | 74 (41.3) | 71 (35.5) | 46 (24.3) |
| Neuraxial | 67 (49.3) | 92 (56.4) | 105 (58.7) | 127 (63.5) | 141 (74.6) | |
| Others | 0 (0.0) | 0 (0.0) | 0 (0.0) | *(1.0) | * (1.1) | |
| Total | 136 (100) | 163 (100) | 179 (100) | 200 (100) | 189 (100) | |
| SK | General | 293 (26.7) | 364 (30.0) | 436 (28.3) | 474 (31.)3 | 437 (31.6) |
| Neuraxial | 781 (71.2) | 836 (68.9) | 1080 (70.0) | 1023 (67.5) | 929 (67.1) | |
| Combined | 10 (0.9) | 9 (0.7) | 16 (1.0) | 16 (1.1) | 11 (0.8) | |
| Others | 13 (1.2) | *(0.3) | 10 (0.6) | *(0.2) | 8 (0.6) | |
| Total | 1097 (100) | 1213 (100) | 1542 (100) | 1516 (100) | 1385 (100) | |
| TE† | General | 0 (0.0) | 0 (0.0) | 0 (0.0) | 5 (19.2) | 6 (20.7) |
| Neuraxial | 0 (0.0) | 15 (78.9) | 13 (81.3) | 21 (80.8) | 23 (79.3) | |
| Others | *(100.0) | * (21.1) | *(18.8) | 0 (0.0) | 0 (0.0) | |
| Total | * (100) | 19 (100) | 16 (100) | 26 (100) | 29 (100) |
Data presented as n (%); †Combined anesthesia use was not reported
In accordance with CIHI’s cell suppression practice, cells containing N < 5 and are replaced by * – “Not reportable”.
‡Year refers to fiscal year in the tables
Total-Knee Arthroplasty:
NA was most commonly used (N = 164,321; 80.3%); followed by GA (N = 31,694; 15.5%); combined (N = 7,282; 3.6%) and others (N = 1,374; 0.7%). Figure 3 indicates NA use increased from 78.9% in 2011 to 81.9% in 2015 (relative risk .96; 95% CI, 0.95 to 0.97).
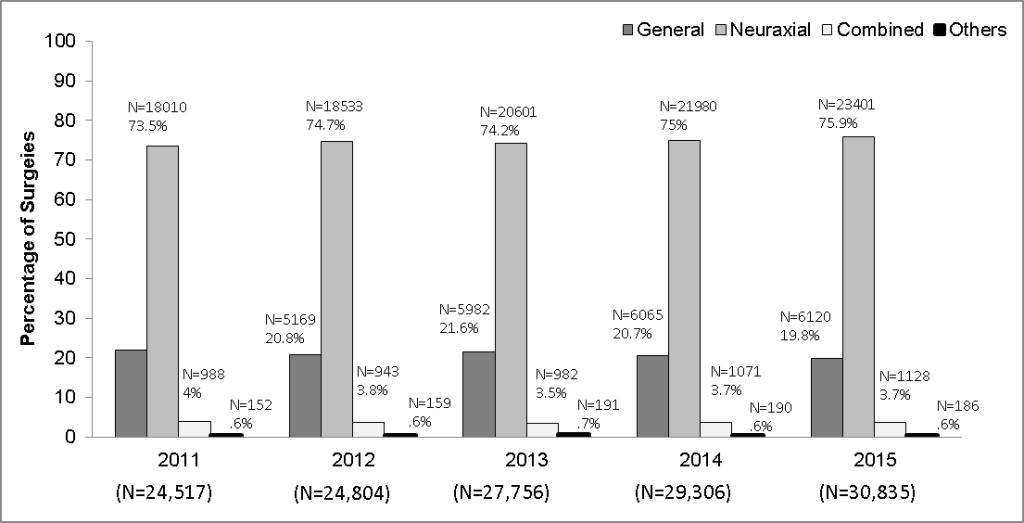
Figure 3: Anesthesia choice for TKA across Canada (N = 204671)
The association between year and type of anesthesia was significant (p < 0.001, but small Cramer’s V = .04). NA was most commonly used in both institutions (NNTI = 103027, 80.5%; NTI = 61294, 80.6%); followed by GA (NNTI = 19332, 15.1%; NTI = 12362, 16.2%) and combined (NNTI = 5174,4%; NTI = 218,2.8%). In NB (46.5%) and NS (57.2%) GA was preferred over neuraxial (Figure 4).
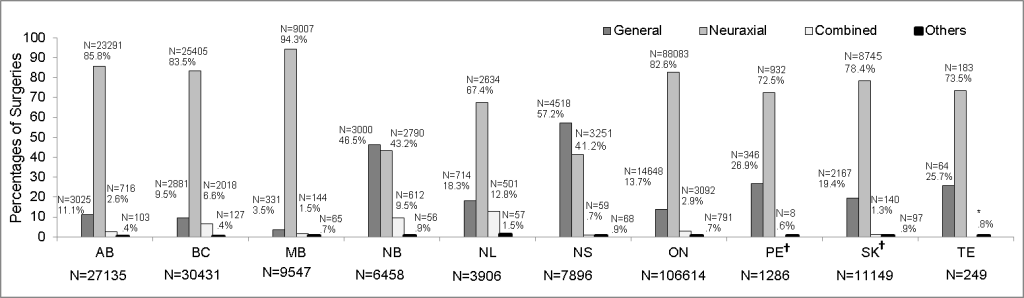
Figure 4: Comparison of anesthetic practice for TKA in different provinces (N = 204671)
*Actual N supressed
†Surgeries carried out with combined general and regional spinal/ epidural was not available for PE and TE
‡Year refers to Fiscal year in the graphs
Table 2 shows NA use increased in NS (37.2% in 2011 to 44.4% in 2015; relative risk .84; 95% CI, 0.77 to 0.91). The association between year and type of anesthesia in NS was significant (p < 0.001, but small Cramer’s V = 0.1). NA use increased in MB (92.1% in 2011 to 96.5% in 2015; relative risk, 0.97; 95%CI, 0.95 to 0.98). The association between year and type of anesthesia in MB was significant (p < 0.001; but small Cramer’s V = 0.1).
Table 2: Year-wise anesthesia choices for TKA in the provinces. Data given as n (%)
| 2011 | 2012 | 2013 | 2014 | 2015 | ||
| AB | General | 722 (14.1) | 606 (11.6) | 552 (10.2) | 574 (10.4) | 571 (9.8) |
| Neuraxial | 4259 (83.3) | 4485 (85.7) | 4736 (87.2) | 4755 (86.2) | 5056 (86.6) | |
| Combined | 121 (2.4) | 131 (2.5) | 125 (2.3) | 149 (2.7) | 190 (3.3) | |
| Others | 12 (0.2) | 13 (0.2) | 19 (0.3) | 36 (0.7) | 23 (0.4) | |
| Total | 5114 (100) | 5235 (100) | 5432 (100) | 5514 (100) | 5840 (100) | |
| BC | General | 633 (10.6) | 551 (9.3) | 560 (9.8) | 547 (8.9) | 590 (8.8) |
| Neuraxial | 4909 (82.5) | 4993 (84.4) | 4746 (82.8) | 5132 (83.5) | 5625 (84.1) | |
| Combined | 397 (6.7) | 353 (6.0) | 389 (6.8) | 435 (7.1) | 444 (6.6) | |
| Others | 12 (0.2) | 20 (0.3) | 34 (0.6) | 30 (0.5) | 31 (0.5) | |
| Total | 5951 (100) | 5917 (100) | 5729 (100) | 6144 (100) | 6690 (100) | |
| MB | General | 87 (4.6) | 70 (3.7) | 73 (3.7) | 65 (3.4) | 36 (1.9) |
| Neuraxial | 1724 (92.1) | 1754 (93.4) | 1889 (94.5) | 1808 (95.1) | 1832 (96.5) | |
| Combined | 24 (1.3) | 45 (2.4) | 27 (1.4) | 23 (1.2) | 25 (1.3) | |
| Others | 37 (2.0) | 8 (0.4) | 9 (0.5) | 6 (0.3) | 5 (0.3) | |
| Total | 1872 (100) | 1877 (100) | 1998 (100) | 1902 (100) | 1898 (100) | |
| NB | General | 546 (44.5) | 510 (45.9) | 607 (47.4) | 652 (48.6) | 685 (45.)7 |
| Neuraxial | 537 (43.8) | 491 (44.2) | 548 (42.8) | 548 (40.9) | 666 (44.4) | |
| Combined | 135 (11.0) | 100 (9.0) | 117 (9.1) | 122 (9.1) | 138 (9.2) | |
| Others | 8 (0.7) | 10 (0.9) | 9 (0.7) | 19 (1.4) | 10 (0.7) | |
| Total | 1226 (100) | 1111 (100) | 1281 (100) | 1341 (100) | 1499 (100) | |
| NL | General | 132 (17.4) | 155 (21.2) | 155 (18.4) | 136 (17.3) | 136 (17.3) |
| Neuraxial | 462 (60.9) | 467 (63.9) | 554 (65.8) | 568 (72.2) | 583 (74.0) | |
| Combined | 146 (19.3) | 101 (13.8) | 119 (14.1) | 77 (9.8) | 58 (7.4) | |
| Others | 18 (2.4) | 8 (1.1) | 14 (1.7) | 6 (0.8) | 11 (1.4) | |
| Total | 758 (100) | 731 (100) | 842 (100) | 787 (100) | 788 (100) | |
| NS | General | 921 (61.4) | 853 (56.8) | 943 (59.0) | 911 (54.8) | 890 (54.5) |
| Neuraxial | 558 (37.2) | 610 (40.6) | 624 (39.1) | 733 (44.1) | 726 (44.4) | |
| Combined | 7 (0.5) | 23 (1.5) | 15 (0.9) | 8 (0.5) | 6 (0.4) | |
| Others | 13 (0.9) | 17 (1.1) | 15 (0.9) | 11 (0.7) | 12 (0.7) | |
| Total | 1499 (100) | 1503 (100) | 1597 (100) | 1663 (100) | 1634 (100) | |
| ON | General | 2885 (14.8) | 2938 (14.3) | 3087 (14.1) | 3090 (13.9) | 2648 (11.7) |
| Neuraxial | 15952 (81.6) | 16832 (82.0) | 18011 (82.5) | 18280 (82.4) | 19008 (84.3) | |
| Combined | 566 (2.9) | 591 (2.9) | 603 (2.8) | 618 (2.8) | 714 (3.2) | |
| Others | 135 (0.7) | 156 (0.8) | 123 (0.6) | 201 (0.9) | 176 (0.8) | |
| Total | 19538 (100) | 20517 (100) | 21824 (100) | 22189 (100) | 22546 (100) | |
| PE† | General | 69 (33.3) | 88 (31.9) | 82 (28.3) | 69 (26.0) | 38 (15.3) |
| Neuraxial | 138 (66.7) | 188 (68.1) | 207 (71.4) | 193 (72.8) | 206 (83.1) | |
| Others | 0 (0.0) | 0 (0.0) | * (0.3) | * (1.1) | * (1.6) | |
| Total | 207 (100) | 276 (100) | 290 (100) | 265 (100) | 248 (100) | |
| SK | General | 320 (18.7) | 423 (19.6) | 597 (22.5) | 489 (19.6) | 338 (15.9) |
| Neuraxial | 1348 (78.9) | 1708 (79.0) | 2002 (75.4) | 1959 (78.4) | 1728 (81.4) | |
| Combined | 19 (1.1) | 22 (1.0) | 34 (1.3) | 40 (1.6) | 25 (1.2) | |
| Others | 21 (1.2) | 9 (0.4) | 23 (0.9) | 12 (0.5) | 32 (1.5) | |
| Total | 1708 (100) | 2162 (100) | 2656 (100) | 2500 (100) | 2123 (100) | |
| TE† | General | 8 (27.6) | 14 (25.)9 | 6 (13.6) | 16 (27.6) | 20 (31.3) |
| Neuraxial | 21 (72.4) | 40 (74.1) | 38 (86.4) | 41 (70.7) | 43 (67.2) | |
| Combined | 0 (0.0) | 0 (0.0) | 0 (0.0) | *(1.7) | *(1.7) | |
| Others | 0 (0.0) | 0 (0.0) | 0 (0.0) | 0 (0.0) | 0 (0.0) | |
| Total | 29 (100) | 54 (100) | 44 (100) | 58 (100) | 64 (100) |
†Combined anesthesia use was not reported
In accordance with CIHI’s cell suppression practice, cells containing N < 5 and are replaced by * – “Not reportable”.
‡Year refers to Fiscal year in the tables
DISCUSSION
The results of this analysis show that contrary to the stated hypothesis and observation made in other studies,9,14 NA was the anesthetic of choice for both THA and TKA during the entire study period in Canada. NA was most frequently compared to GA in both non-teaching and TIs. Inter-provincial comparisons revealed an almost across-the-board preference for NA, with the exceptions being NB and NS, where GA was more frequently used. Use of NA within the individual provinces, for both THAs and TKAs, increased gradually with a modest gradual decrease in use of GA. MB had the highest utilization of NA and showed a steady increase in neuraxial utilization, 90.6% – 94.5% for THA and 92.1% – 96.5% for TKA during the study period. The noted increase in use of GA in NB and NS stood in contrast to Newfoundland (NL) and Prince Edward Island (PE), which are in the same geographic region as NB and NS. The noted increase in use of GA in NB and NS is also in contrast with Saskatchewan, all three provinces have comparable surgical volumes, but NA was preferred in Saskatchewan. Overall the anesthetic preference in provinces with large surgical volumes, such as British Columbia and Ontario, was comparable to provinces with smaller surgical volumes, such as PE and TE. Inter-provincial differences in rates of healthcare use and levels of income-related inequity have been reported in previous research.15 CIHI data also indicates interprovincial differences, with longer wait times for hip and knee surgery in NB and NS compared to other provinces in Canada.16 However, our study shows that in NB (not statistically significant) and NS, the use of NA has increased gradually. Whether it is an incidental finding or a determined effort to change can be explored in a future study. Speculatively, a change in anesthesia practitioners’ team or a shift in systemic policy could account for this type of change.
Literature review indicates that NA is not adopted universally.14 Clinical and cost benefits are not consistently observed for NA when compared with GA for THAs and TKAs.17-20 In a systematic review decreased length of stay was observed when NA was used compared to GA (Johnson et al. 2016). However, no difference in mortality, surgical difference, surgical site or chest infections, nerve palsies, postoperative nausea and vomiting etc. was observed when NA was compared with GA.19 Further, in a randomized trial for TKAs GA was associated with better outcome such a short length of stay, less nausea, vomiting and dizziness, less pain 6 hours after surgery, less usage of analgesia and morphine, patients were able to walk earlier and fewer patients requested a change in methods of anesthesia in their subsequent surgery compared to spinal anesthesia.18 A more recent study in US has shown that use of NA is more predominant in medium sized and non-teaching centers. The same study observed a decrease in hospital cost when NA is used but other clinical outcome were similar irrespective of choice of anesthesia. Considering the volume of THAs and TKAs performed annually at any center reduced cost and comparable clinical outcomes might be desirable.14 However, patient satisfaction, effective perioperative and post-operative pain control are important aspects of patient care and essential for effective rehabilitation. Factors such as patient preferences, comorbidities, surgical considerations and surgery type (elective/emergent) should be taken into account when determining anesthetics for patients,17,20 It would be neither possible nor appropriate to achieve a 100% rate of neuraxial use. We recommend a greater collaboration among the provinces to learn from each other’s experience and facilitate compliance with best practices in developing an acceptable proportion of GA for THA and TKA.
This is the first study exploring anesthetic preferences for THAs and TKAs in Canada. A difference in anesthesia preferences between Canada and United States is observed.9,14 In the United States, GA accounted for 55.3% and 61.5% of the total number of THAs and TKAs, respectively.9 GA was preferred in academic institutions compared to nonacademic institutions, where NA was preferred, whereas in Canada, NA use was predominant in both the teaching and NTIs.9 The choice of anesthesia type in Canada is more closely aligned with evidence-based best practices recommending neuraxial anesthetics for THAs and THAs. Canadian healthcare delivery system is comparable to other countries with similar demographics listed by Organization for Economic Cooperation and Development (OECD)21 and has been rated favorably on certain indicators such as healthcare expenditure, range of services, universal access to healthcare without financial barriers and superior health status.22
LIMITATIONS
As a retrospective study analyses were restricted to data from administrative databases at CIHI which are not coded for research particularly and therefore relevant data might be missing or coded incorrectly, data can be misclassified during abstraction or not recorded at all In the present study, patient level and admission level variables were not included; perioperative outcomes and data from Quebec were not reported. Other forms of single shot or catheter based regional techniques such as femoral or adductor canal blocks and Epidural vs. CSE (prior to 2015) could not be reported. Due to these, limitations only non-parametric tests were carried out, which suggest association between the variables without implicating causality.23 The present study only aims to describe the choice of anesthesia type for joint surgeries across Canada during the study period without proposing any causal relationship between choices of anesthesia type with year, province or institution type. Nevertheless, administrative health data is widely employed in Canada and abroad to study health outcomes,2,5,24 effectiveness, appropriateness and utilization of healthcare services and to identify pertinent research questions.14,23,25
CIHI acknowledges the importance of data quality for member stakeholders and researchers.26 Several measure are taken to ensure data quality,26 and the data quality program of CIHI is recognized for its comprehensiveness and high standards both nationally and internationally.
CONCLUSION
Although the benefits of neuraxial anesthesia are well documented, this study is the first to examine the extent to which these recommendations were implemented across Canada. This study is important as it identifies provinces where there is opportunity for improvement. Follow-up studies can examine whether adherence to best practice also translates into positive patient outcomes nationwide and results in cost savings. This study provides a benchmark to ensure that in subsequent years, anesthetic practices at institutional, provincial and national levels remain closely aligned with best practices. In summary, neuraxial anesthesia was the anesthetic of choice across the majority of provinces in Canada for total hip and knee replacements, with a trend towards a modest increase in its use over the five-year study period.
Implication Statement: The study findings can serves as reference for clinicians to better align their clinical practice with the recommended guidelines and with their center’s practice trends. However, clinicians should also consider patient factors, patient satisfaction and effective pain management during and post-operatively while choosing appropriate anesthesia for THAs and TKAs. The study results will help guide future work that should examine clinical and cost benefits of using neuraxial anesthesia and identify most effective anesthesia for hip and knee joint replacements for our patient population.
Acknowledgement: Saskatchewan Health Authority (Former Regina Qu’Appelle Health Region) Regina, Saskatchewan provided the funding to cover the cost of data requisition from CIHI for the study and for additional in-kind support provided to complete the research project and prepare the manuscript. We acknowledge Zachary Wolfmueller, M.D. for helping draft development.
Competing interests: The authors declare that they have no competing interests
Authors’ contribution:
RM – Concept, manuscript writing
MP-Data analysis, manuscript writing
KJ- Literature search, data entry, manuscript writing
MAS-Manuscript editing and final review
Appendix 1: Abbreviations for the provinces of Canada with population
| Provinces | Abbreviations | Population |
| Ontario | ON | 14,566,547 |
| Quebec | QC | 8,484,965 |
| Nova Scotia | NS | 971,395 |
| New Brunswick | NB | 776,827 |
| Manitoba | MB | 1,369,465 |
| British Columbia | BC | 5,071,336 |
| Prince Edward Island | PE | 156,947 |
| Saskatchewan | SK | 1,174,462 |
| Alberta | AB | 4,371,316 |
| Newfoundland + Labrador | NL | 521,542 |
REFERENCES
- Perlas A, Chan VW, Beattie S. Anesthesia technique and mortality after total hip or knee arthroplasty: a retrospective, propensity score-matched cohort study. Anesthesiology. 2016;125(4):724-31. [PubMed] DOI: 10.1097/ALN.0000000000001248
- Memtsoudis SG, Sun X, Chiu YL, Stundner O, Liu SS, Banerjee S, et al. Perioperative comparative effectiveness of anesthetic technique in orthopedic patients. Anesthesiology. 2013;118(5):1046-58. [PubMed] DOI: 10.1097/ALN.0b013e318286061d
- Pugely AJ, Martin CT, Gao Y, Mendoza-Lattes S, Callaghan JJ. Differences in short-term complications between spinal and general anesthesia for primary total knee arthroplasty. J Bone Joint Surg Am. 2013;95(3):193-9. [PubMed] DOI: 10.2106/JBJS.K.01682
- Macfarlane AJ, Prasad GA, Chan VW, Brull R. Does regional anesthesia improve outcome after total knee arthroplasty? Clin Orthop Relat Res. 2009;467(9):2379-402. [PubMed] DOI: 10.1007/s11999-008-0666-9
- Memtsoudis SG, Rasul R, Suzuki S, Poeran J, Danninger T, Wu C, et al. Does the impact of the type of anesthesia on outcomes differ by patient age and comorbidity burden? Reg Anesth Pain Med. 2014;39(2):112-9. [PubMed] DOI: 10.1097/AAP.0000000000000055
- Memtsoudis SG, Danninger T, Rasul R, Poeran J, Gerner P, Stundner O, et al. Inpatient falls after total knee arthroplasty: the role of anesthesia type and peripheral nerve blocks. Anesthesiology. 2014;120(3):551-63. [PubMed] DOI: 10.1097/ALN.0000000000000120
- Fields AC, Dieterich JD, Buterbaugh K, Moucha CS. Short-term complications in hip fracture surgery using spinal versus general anaesthesia. Injury. 2015;46(4):719-23. [PubMed] DOI: 10.1016/j.injury.2015.02.002
- Translating research into practice (TRIP)-II: fact sheet. Agency for Healthcare Research and Quality, Rockville, MD. Available from: Available from: http://archive.ahrq.gov/research/findings/factsheets/translating/tripfac/trip2fac.html [Accessed January 2018].
- Wanderer JP, Rathmell JP. Complex information for anesthesiologists presented quickly and clearly: knee and hip arthroplasty: variations in use of regional anesthesia. Anesthesiology. 2014;120(3):A3. [PubMed] DOI: 10.1097/01.anes.0000444099.91832.9c
- What is academic healthcare? research in canada’s patient care organizations. HealthCareCAN, Ottawa, ON. Available from: http://www.healthcarecan.ca/wp-content/uploads/2016/09/What-is-Academic-Healthcare_FinalDraft.pdf [Accessed Dec 2017].
- Field A. Discovering statistics using SPSS. London: Sage Publication; 2009. p. 698.
- Cohen J. Statistical power analysis for behavioural science. 2nd ed. New York: Academic Press; 1988.
- Cohen J. A power primer. Psychol Bull. 1992;112(1):155-9. [PubMed] DOI: 10.1037//0033-2909.112.1.155
- Memtsoudis SG, Poeran J, Zubizarreta N, Olson A, Cozowicz C, Morwald EE, et al. Do hospitals performing frequent neuraxial anesthesia for hip and knee replacements have better outcomes? Anesthesiology. 2018;129(3):428-39. [PubMed] DOI: 10.1097/ALN.0000000000002299
- Allin S. Does equity in healthcare use vary across canadian provinces? Healthc Policy. 2008;3(4):83-99. [PubMed]
- OECD interactive tool: international comparison –peer countries Canada. CIHI. Available from: https://www.cihi.ca/en/oecd-interactive-tool-international-comparisons-peer-countries-canada [Accessed March 2018].
- Choi S, Trang A, McCartney CJ. Reporting functional outcome after knee arthroplasty and regional anesthesia: a methodological primer. Regional anesthesia and pain medicine. 2013;38(4):340-9. [PubMed] DOI: 10.1097/AAP.0b013e318295d973
- Harsten A, Kehlet H, Toksvig-Larsen S. Recovery after total intravenous general anaesthesia or spinal anaesthesia for total knee arthroplasty: a randomized trial. Br J Anaesth. 2013;111(3):391-9. [PubMed] DOI: 10.1093/bja/aet104
- Johnson RL, Kopp SL, Burkle CM, Duncan CM, Jacob AK, Erwin PJ, et al. Neuraxial vs general anaesthesia for total hip and total knee arthroplasty: a systematic review of comparative-effectiveness research. Br J Anaesth. 2016;116(2):163-76. [PubMed] DOI: 10.1093/bja/aev455
- McCartney CJ, Choi S. Does anaesthetic technique really matter for total knee arthroplasty? Br J Anaesth. 2013;111(3):331-3. [PubMed] DOI: 10.1093/bja/aet200
- Geographic variation in health care. what do we know and what can be done to improve health system performance. OECD Health policy Studies. Available from: https://www.oecd.org/els/health-systems/FOCUS-on-Geographic-Variations-in-Health-Care.pdf [Accessed Nov 2017].
- Ridic G, Gleason S, Ridic O. Comparisons of health care systems in the United States, Germany and Canada. Mater Sociomed. 2012;24(2):112-20. [PubMed] DOI: 10.5455/msm.2012.24.112-120
- Ward RA, Brier ME. Retrospective analyses of large medical databases: what do they tell us? J Am Soc Nephrol. 1999;10(2):429-32. [PubMed]
- Sedgwick P. Retrospective cohort studies: advantages and disadvantages. BMJ. 2014;348. DOI: 10.1136/bmj.g1072
- De Coster C, Quan H, Finlayson A, Gao M, Halfon P, Humphries KH, et al. Identifying priorities in methodological research using ICD-9-CM and ICD-10 administrative data: report from an international consortium. BMC Health Serv Res. 2006;6:77. [PubMed] DOI: 10.1186/1472-6963-6-77
- Data quality | CIHI. Available from: https://www.cihi.ca/en/data-quality#_Provincial/Territorial_Data_Quality [Accessed March 2018].
