Ahmed A. El-Shimy *1 , Afaf Abdel Hafez 2 , Tarek El-Sayed Gouda 3 , Samar A. Mousa 4
Authors affiliations:
Background: Sepsis-induced cardiac dysfunction (SICD) is common in sepsis and septic shock. Although traditionally focused on left ventricular dysfunction, right ventricular (RV) impairment may have important prognostic value. This study evaluated the relationship between RV performance and severity and outcome in sepsis and septic shock.
Methods: This prospective cohort study included 50 adults admitted to the Critical Care Medicine Unit, Mansoura University Hospitals, between June 2024 and June 2025 with sepsis or septic shock. Transthoracic echocardiography was performed within 12 hours of admission and repeated during follow-up for up to 7 days. RV assessment included tissue Doppler-derived tricuspid annular systolic velocity (TV S′), tricuspid E/e′ ratio, RV myocardial performance index (MPI), tricuspid annular plane systolic excursion (TAPSE), pulmonary artery systolic pressure (PASP), and TAPSE/PASP ratio. Patients were classified by sepsis severity and survival status. The primary outcome was in-hospital mortality; the secondary outcome was intensive care unit length of stay.
Results: Septic shock was associated with lower TAPSE (P = 0.015), TAPSE/PASP ratio (P = 0.003), and TV S′ (P = 0.009), and higher RV MPI (P = 0.001) and TV E/e′ (P = 0.007). Baseline TV S′, TAPSE, and TAPSE/PASP were comparable between survivors and non-survivors, but decreased significantly during follow-up in non-survivors (P = 0.001 for each). Non-survivors also showed increasing RV filling pressures, lactate, neutrophil-to-lymphocyte ratio, and troponin (P ≤ 0.005).
Conclusions: RV dysfunction, particularly reduced TAPSE/PASP ratio, lower TV S′, and higher RV MPI, provides clinically relevant prognostic information for septic shock progression and short-term mortality.
Keywords: Echocardiography; Myocardial performance index; Sepsis-induced cardiac dysfunction; Sepsis; Septic shock; Right ventricular dysfunction; Tissue Doppler imaging
Abbreviations: MPI: myocardial performance index, RV: right ventricular, SICD: Sepsis-induced cardiac dysfunction. TAPSE: tricuspid annular plane systolic excursion
Citation: El-Shimy AA, Hafez AA, Gouda TES, Mousa SA. Right ventricular functions in sepsis and septic shock: relation to risk stratification and short-term outcomes. Anaesth. pain intensive care 2026;30(3):669-683. DOI: 10.35975/apic.v30i6.3262
Received: May 14, 2026; Revised: June 10, 2026; Accepted: June 10, 2026
Sepsis remains a major global health problem, affecting an estimated 48.9 million individuals annually and causing approximately 11 million deaths worldwide.1 Cardiovascular failure is a key determinant of prognosis in sepsis and septic shock.2 Sepsis-induced cardiac dysfunction (SICD) is an acute and potentially reversible myocardial dysfunction that occurs during sepsis in the absence of primary coronary artery disease. It results from inflammatory, oxidative, cellular, and hemodynamic mechanisms and may affect the left ventricle (LV), right ventricle (RV), or both.3,4
Bedside echocardiography is central to the evaluation of SICD because it permits repeated, non-invasive assessment of cardiac performance in critically ill patients.5 Transthoracic echocardiography (TTE), particularly when combined with tissue Doppler imaging (TDI), enables quantitative evaluation of RV function. Tricuspid annular systolic velocity (S′) reflects RV systolic performance, whereas the myocardial performance index (MPI) provides an integrated estimate of global RV systolic and diastolic function.6
Although RV dysfunction is increasingly recognized as a predictor of mortality in sepsis and septic shock, existing evidence is predominantly observational and heterogeneous with respect to definitions, timing of assessment, and outcome measures.7 Moreover, data from Egyptian intensive care populations remain limited. This is clinically relevant because local case mix, infection patterns, referral pathways, and resource availability may influence both cardiac involvement and short-term outcomes. Previous Egyptian evidence suggests that RV dysfunction is common and prognostically important in early sepsis; however, further evaluation using focused RV echocardiographic parameters remains warranted.8
In this prospective observational study, we aimed to assess RV function in Egyptian patients with sepsis and septic shock and to determine its association with risk stratification and short-term outcome. RV function was evaluated using TTE-derived TDI indices, including S′ and MPI. We hypothesized that RV dysfunction is associated with higher clinical risk and poorer short-term outcome.
This prospective observational cohort study was conducted in the Critical Care Medicine Unit at the Specialized Medical Hospital, Mansoura University, Egypt, between June 2024 and July 2025. All eligible adult patients admitted to the intensive care unit (ICU) with sepsis or septic shock during the study period were prospectively screened for inclusion. The study was designed and reported in accordance with the Strengthening the Reporting of Observational Studies in Epidemiology (STROBE) statement for cohort studies.9 The study protocol was reviewed and approved by the Medical Research Ethics Committee, Institutional Review Board, Mansoura Faculty of Medicine, Mansoura University, Egypt. The approval letter was issued on 07 April 2024 under approval code (MD.24.03.843).
2.2. Study Population
The study included 50 adult patients admitted to the ICU with sepsis or septic shock. Patients were classified into two groups based on disease severity: sepsis and septic shock, according to the Sepsis-3 consensus definitions and the Surviving Sepsis Campaign 2021 guidelines.4,10 For outcome analysis, patients were further classified by in-hospital survival status as survivors or non-survivors. The primary analytical focus was the association between right ventricular echocardiographic parameters and both septic shock status and short-term mortality.
2.3. Diagnostic Definitions
Sepsis and septic shock were diagnosed according to the Surviving Sepsis Campaign 2021 guidelines and the Sepsis-3 consensus definitions. Sepsis was defined as life-threatening organ dysfunction caused by a dysregulated host response to infection. Septic shock was defined as a subset of sepsis characterized by persistent circulatory, cellular, and metabolic abnormalities, including the need for vasopressor therapy to maintain adequate mean arterial pressure and elevated serum lactate despite adequate fluid resuscitation, when applicable.4,10 The Surviving Sepsis Campaign recommends an initial mean arterial pressure target of 65 mmHg in adults with septic shock receiving vasopressors.4
Patients were eligible for inclusion if they were aged 18 years or older, admitted to the ICU with sepsis or septic shock, and had an adequate transthoracic echocardiographic assessment within 12 hours of ICU admission. Written informed consent was obtained from each patient or from a legally authorized representative when the patient was unable to provide consent, in accordance with the Declaration of Helsinki.11
Patients were excluded if they had any of the following: age below 18 years; acute coronary syndrome within the preceding week; established heart failure, defined as left ventricular ejection fraction less than 50% or grade III diastolic dysfunction; atrial fibrillation; prosthetic heart valves; severe mitral, aortic, or tricuspid valve stenosis or regurgitation; moderate to severe pulmonary hypertension; end-stage renal disease; documented substance abuse or addiction; pregnancy; inadequate echocardiographic acoustic window; or refusal to provide informed consent. These criteria were applied to reduce confounding from pre-existing cardiovascular, pulmonary vascular, rhythm-related, and renal conditions that could independently affect right ventricular structure, right ventricular loading conditions, or echocardiographic measurements.
The sample size was calculated using the single-population proportion formula:
n = Z² × P × (1 − P) / d²
where n is the required sample size, Z is the standard normal deviate at a 95% confidence level, P is the expected proportion of right ventricular dysfunction based on previous literature, and d is the accepted absolute precision.
Bendary et al. (2022)8 included 248 patients with sepsis and septic shock and reported that 48.4% of the study population had evidence of right ventricular dysfunction, either isolated or associated with left ventricular dysfunction. Therefore, the expected proportion was set at P = 0.484. Using a 95% confidence level (Z = 1.96) and an accepted absolute precision of 14% (d = 0.14), the required sample size was calculated as follows:
n = (1.96) ² × 0.484 × (1 − 0.484) / (0.14) ²
n = 3.8416 × 0.484 × 0.516 / 0.0196
n = 48.95
Thus, the minimum required sample size was approximately 49 patients, rounded up to 50. Accordingly, the final enrolled cohort of 50 patients was considered adequate for this prospective observational study.
Demographic and clinical data were collected prospectively. This included age, sex, residence, sepsis category, need for mechanical ventilation, ICU length of stay, and in-hospital survival status. Hemodynamic variables included mean arterial pressure, heart rate, diastolic blood pressure, diastolic shock index, and central venous oxygen saturation. The diastolic shock index was calculated as heart rate divided by diastolic blood pressure.
Severity of illness was assessed on intensive care unit admission using the Sequential Organ Failure Assessment (SOFA) score and the Acute Physiology and Chronic Health Evaluation II (APACHE II) score. The SOFA score was used to describe the degree of organ dysfunction/failure, while the APACHE II score was used as a severity-of-disease classification system for critically ill patients. Both scores were calculated on the day of admission and used for baseline clinical risk stratification. Mortality was recorded throughout hospitalization.12,13
Laboratory investigations were obtained at baseline and monitored during follow-up according to intensive care unit practice. The assessed laboratory variables included complete blood count with differential count, neutrophil-to-lymphocyte ratio (NLR), serum lactate, and cardiac troponin I. NLR was calculated by dividing the absolute neutrophil count by the absolute lymphocyte count and was used as an inflammatory marker in critically ill septic patients.14 Serum lactate was assessed as a marker of tissue hypoperfusion and metabolic stress; the Surviving Sepsis Campaign 2021 guidelines recommend using serum lactate to guide resuscitation in adults with sepsis or septic shock when lactate is elevated.4 Cardiac troponin I was measured as a marker of myocardial injury, as elevated troponin I has been associated with myocardial dysfunction, increased sepsis severity, and higher mortality in septic shock.15
All patients underwent bedside transthoracic echocardiography using a GE Vivid T8 cardiovascular ultrasound system (GE Healthcare, Wuxi, China). The first echocardiographic examination was performed within 12 hours of ICU admission. Follow-up echocardiography was repeated daily for a maximum of seven days when clinically feasible.
Echocardiographic examinations were performed by two experienced operators who were blinded to patients’ clinical data. Standard views were acquired, including parasternal long-axis, parasternal short-axis, apical four-chamber, and apical two-chamber views. Three consecutive cardiac cycles were measured and averaged for each parameter. Measurements with interobserver variability greater than 5% were excluded. Echocardiographic acquisition and interpretation followed the American Society of Echocardiography recommendations for right-heart assessment and cardiac chamber quantification.6,16,17
Right ventricular systolic function was assessed using a multiparametric approach, including tricuspid annular plane systolic excursion, tissue Doppler-derived tricuspid annular systolic velocity, right ventricular myocardial performance index, pulmonary artery systolic pressure, and the tricuspid annular plane systolic excursion/pulmonary artery systolic pressure ratio.
Tricuspid annular plane systolic excursion was measured by M-mode echocardiography in the apical four-chamber view, with the cursor aligned along the lateral tricuspid annulus. Tissue Doppler-derived tricuspid annular systolic velocity was obtained using pulsed-wave tissue Doppler imaging, with the sample volume positioned at the lateral tricuspid annulus. These parameters were selected because they provide feasible and reproducible bedside measures of right ventricular longitudinal systolic performance.6,16
Right ventricular myocardial performance index, also known as the Tei index, was calculated from tissue Doppler-derived time intervals. Isovolumetric contraction time, isovolumetric relaxation time, and ejection time were measured, and the right ventricular myocardial performance index was calculated as follows:
Right ventricular myocardial performance index = (isovolumetric contraction time + isovolumetric relaxation time) / ejection time
When tricuspid valve closure-to-opening time was used, right ventricular myocardial performance index was calculated as:
Right ventricular myocardial performance index = (tricuspid valve closure-to-opening time − ejection time) / ejection time
Right ventricular myocardial performance index was used as an index of global right ventricular performance because it incorporates both systolic and diastolic time intervals. Higher values indicate impaired global right ventricular function.16,17
Pulmonary artery systolic pressure was estimated from the peak tricuspid regurgitation velocity, when measurable, together with estimated right atrial pressure according to standard echocardiographic recommendations. The tricuspid annular plane systolic excursion/pulmonary artery systolic pressure ratio was calculated as an index of right ventricular–pulmonary arterial coupling. Lower values indicate impaired right ventricular adaptation to pulmonary arterial load and suggest right ventricular–pulmonary arterial uncoupling.
Right ventricular diastolic function was assessed using trans-tricuspid Doppler inflow and tissue Doppler-derived annular velocities. The measured parameters included tricuspid E velocity, tricuspid A velocity, tricuspid E/A ratio, tricuspid annular early diastolic velocity, and tricuspid E/e′ ratio. Tricuspid E/e′ was used as an estimate of right ventricular filling pressure according to standardized right-heart echocardiographic methodology.16,17
Left ventricular systolic function was evaluated using left ventricular ejection fraction, mitral annular plane systolic excursion, mitral annular systolic velocity, and left ventricular myocardial performance index. Left ventricular ejection fraction was calculated using the modified biplane Simpson’s method from apical four-chamber and apical two-chamber views, according to chamber quantification recommendations.6
Mitral annular plane systolic excursion was measured as the longitudinal systolic displacement of the mitral annulus. Mitral annular systolic velocity was obtained by pulsed-wave tissue Doppler imaging from the lateral mitral annulus. Left ventricular myocardial performance index was calculated from tissue Doppler-derived isovolumetric contraction time, isovolumetric relaxation time, and ejection time using the following formula:
Left ventricular myocardial performance index = (isovolumetric contraction time + isovolumetric relaxation time) / ejection time
Left ventricular diastolic function was assessed using transmitral Doppler inflow and tissue Doppler-derived mitral annular velocities. The measured parameters included mitral E velocity, mitral A velocity, mitral E/A ratio, mitral annular e′ velocity, and mitral E/e′ ratio. Mitral E/e′ was used as an echocardiographic estimate of left ventricular filling pressure, in accordance with recommendations for echocardiographic assessment of left ventricular diastolic function.18
The main exposure variables were right ventricular echocardiographic indices, including tricuspid annular systolic velocity, right ventricular myocardial performance index, tricuspid annular plane systolic excursion, pulmonary artery systolic pressure, tricuspid annular plane systolic excursion/pulmonary artery systolic pressure ratio, and tricuspid E/e′ ratio. Additional explanatory variables included age, sex, residence, mechanical ventilation status, Sequential Organ Failure Assessment score, Acute Physiology and Chronic Health Evaluation II score, mean arterial pressure, heart rate, diastolic shock index, central venous oxygen saturation, neutrophil-to-lymphocyte ratio, serum lactate, and troponin I.
The primary outcome was in-hospital mortality. The secondary outcome was ICU length of stay. Additional analyses evaluated the association between right ventricular echocardiographic parameters and septic shock status, as well as the relationship between serial changes in right ventricular parameters and short-term outcome.
Several measures were applied to reduce bias. Consecutive eligible patients were prospectively screened to reduce selection bias. Strict exclusion criteria were applied to minimize confounding from pre-existing heart failure, significant valvular disease, atrial fibrillation, pulmonary hypertension, and inadequate imaging windows. Echocardiographic measurements were performed by two experienced operators blinded to patients’ clinical data to reduce measurement and observer bias. Three consecutive cardiac cycles were averaged for each parameter, and measurements with Interobserver variability greater than 5% were xcluded. Standardized echocardiographic definitions and acquisition methods were used to improve reproducibility and external comparability.
2.1. Statistical Analysis
Statistical analysis was performed using IBM SPSS Statistics for Windows, version 31.0.1.0 (IBM Corp., Armonk, NY, USA). Continuous variables were expressed as mean ± standard deviation. Categorical variables were expressed as frequencies and percentages. The Student’s t-test was used to compare normally distributed continuous variables between two independent groups.
A total of 50 adult patients admitted to the intensive care unit with sepsis or septic shock were included in the final analysis. The mean age was 60.58 ± 12.31 years, and the cohort included 24 males (48%) and 26 females (52%). Thirteen patients (26%) had sepsis, whereas 37 patients (74%) had septic shock. Mechanical ventilation was required in 22 patients (44%). In-hospital mortality occurred in 20 patients (40%), outside-hospital mortality occurred in 3 patients (6%), and 27 patients (54%) were alive. The mean intensive care unit length of stay was 5.0 ± 1.7 days. Baseline clinical severity was high, with mean Sequential Organ Failure Assessment (SOFA) and Physiology and Chronic Health Evaluation II CHE II) scores of 10.2 ± 4.3 and 18.3 test was used to compare categorical variables. When parametric assumptions were not met, nonparametric tests, such as the Mann–Whitney U test, were used as appropriate. Comparisons were performed between patients with sepsis and patients with septic shock and between survivors and non-survivors. Serial changes in clinical, laboratory, and echocardiographic parameters were evaluated during follow-up and compared between groups. Multivariable logistic regression analysis was used to identify independent predictors of septic shock and short-term mortality. Variables with clinical relevance and those showing significant or near-significant associations in group comparisons were included in the regression models. Regression results were reported as regression coefficient, odds ratio, 95% confidence interval, and p-value. Receiver operating characteristic curve analysis was used to assess the discriminatory performance of predictive models for septic shock and mortality. Model performance was reported using the area under the curve, standard error, 95% confidence interval, sensitivity, specificity, and overall predictive accuracy. A two-sided p-value less than 0.05 was considered statistically significant.
Baseline echocardiography demonstrated preserved mean left ventricular ejection fraction (LVEF) of 57 ± 11%. Left ventricular myocardial performance index (LV MPI) was 0.63 ± 0.19, and mitral annular plane systolic excursion (MAPSE) was 13.0 ± 2.3 mm. Right ventricular assessment showed a mean tricuspid valve systolic velocity (TV S′) of 0.17 ± 0.05 m/s, right ventricular myocardial performance index (RV MPI) of 1.1 ± 0.5, pulmonary artery systolic pressure (PASP) of 30.0 ± 10.5 mmHg, tricuspid annular plane systolic excursion (TAPSE) of 18.0 ± 3.6 mm, and TAPSE/PASP ratio of 0.65 ± 0.19. Baseline echocardiographic parameters are summarized in Table 2.
Patients with septic shock had significantly higher SOFA and APACHE II scores than patients with sepsis. On day 1, mean arterial pressure (MAP) was significantly lower in patients with septic shock, whereas ScvO₂ and diastolic shock index (DSI) were significantly higher. Baseline neutrophil-to-lymphocyte
For survival analysis, patients were classified as alive (n = 27) or death (n = 23), following the grouping reported in the manuscript tables. Baseline age, sex, and residence did not differ significantly between groups. Non-survivors had significantly higher SOFA and APACHE II scores, lower day-1 MAP, and higher day-1 DSI. Baseline NLR, lactate, and troponin I were not significantly different between survivors and non-survivors; however, their trajectories increased significantly in non-survivors. Echocardiographically,
In the multivariable logistic regression model for septic shock, DSI was the only statistically significant independent predictor, with an odds ratio of 11.952 and 95% confidence interval of 1.429–99.955. ScvO₂, TAPSE, and TAPSE/PASP approached statistical significance but did not reach the predefined threshold. The receiver operating characteristic (ROC) analysis for the septic shock prediction model showed an area under the curve (AUC) of 0.902, with sensitivity of 81.1%, specificity of 84.6%, and overall prediction of 78%. For short-term mortality, TAPSE/PASP ratio was the only statistically significant independent predictor, with an odds ratio of 0.007 and 95% confidence interval of 0.000–0.432. RV MPI approached statistical significance. The mortality prediction model showed an AUC of 0.816, with sensitivity of 73.9%, specificity of 85.2%, and overall prediction of 76%. Regression and ROC results are summarized in Table 6.
The right ventricular-focused apical four-chamber view used for pulsed tissue Doppler assessment of the lateral tricuspid annulus. This view was used to measure myocardial systolic velocity (S′), which reflects right ventricular longitudinal systolic performance (Figure 1). The tissue Doppler imaging-derived myocardial performance index of the right ventricle. Time 1 represents tricuspid valve closure-to-opening time, and time 2 represents ejection time. In the presented example, MPI was calculated as (349 − 156)/156 = 1.2 (Figure 2).
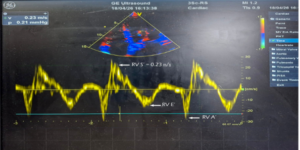
Figure 1: RV-Focused A4C view showing measurement of myocardial systolic velocity (S′) by pulsed tissue Doppler of the lateral tricuspid annulus
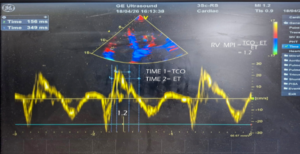
Figure 2: Tissue Doppler imaging (TDI)–derived myocardial performance index (MPI, Tei index) of the right ventricle. Time intervals were measured using TDI: time 1 represents tricuspid valve closure‑to‑opening (TCO), and time 2 represents ejection time (ET). MPI was calculated as (TCO – ET)/ET. In this patient, MPI = (349 – 156)/156 = 1.2.
The main findings were threefold. First, baseline echocardiographic parameters within the first 12 hours were largely comparable between sepsis and septic shock, but serial follow-up over a maximum of seven days revealed a divergent pattern: septic shock and non-survival were associated with dynamic augmentation of LV systolic indices alongside deterioration of RV systolic indices. Second, serial changes in neutrophil-to-lymphocyte ratio (NLR), lactate, and troponin were more prognostically informative than isolated admission values. Third, diastolic shock index (DSI) was the only independent predictor of septic shock, whereas lower tricuspid annular plane systolic excursion/pulmonary artery systolic pressure (TAPSE/PASP) ratio was the only independent predictor of short-term mortality.
Non-survivors had significantly higher Acute Physiology and Chronic Health Evaluation II (APACHE II) and Sequential Organ Failure Assessment (SOFA) scores on admission, supporting their established role as severity and mortality assessment tools in critically ill patients.19 However, these scores did not independently predict septic shock in this cohort, possibly because they reflect established organ dysfunction rather than the hyperacute hemodynamic transition from sepsis to septic shock.20 In contrast, DSI may better capture early circulatory instability because it integrates tachycardia and reduced diastolic pressure.
Admission NLR, lactate, and troponin did not consistently discriminate survivors from non-survivors; however, progressive increases in all three markers during follow-up were strongly associated with mortality. This supports the concept that kinetic biomarker assessment provides greater short-term prognostic resolution than single baseline measurements. These findings are consistent with Alataby et al. (2021), Mungan et al. (2026), and Jendoubi et al. (2019), who emphasized the prognostic importance of dynamic lactate and troponin trajectories in sepsis and critical illness.21,22
The most important finding was the association between RV dysfunction and poor outcome. Patients with septic shock and non-survivors showed deterioration in RV systolic indices, including TAPSE, tricuspid annular systolic velocity (TV S′), TAPSE/PASP ratio, and RV myocardial performance index (RV MPI). This agrees with Koowattanatianchai et al. (2025), Lanspa et al. (2021), and Bendary et al. (2022), who reported that RV impairment is associated with short-term mortality in sepsis and septic shock.8,23,24 However, Agarwal et al. (2025) reported that RV dysfunction may lose independent prognostic significance after adjustment, highlighting the influence of population characteristics, timing of echocardiography, and RV dysfunction definitions.25
Sepsis-induced cardiac dysfunction is not confined to the LV. Reduced systemic vascular resistance may lower LV afterload and preserve or augment LV systolic indices, whereas acute lung injury, pulmonary vasoconstriction, hypoxia, hypercapnia, positive-pressure ventilation, and pulmonary microvascular obstruction increase RV afterload (Asllanaj et al., 2023; Guazzi and Labate, 2016; Murphy and Shelley, 2019). Because the RV has limited tolerance to abrupt afterload elevation, RV dysfunction may appear before overt LV systolic impairment becomes evident.24 Mechanistically, increased pulmonary vascular resistance, reduced nitric oxide availability, platelet–leukocyte aggregation, septal displacement, reduced LV filling, and increased RV oxygen demand may contribute to RV–pulmonary arterial uncoupling and circulatory failure.26-29
The observed increase in RV MPI and reduction in TV S′ among patients with shock and non-survivors are consistent with Harmankaya et al. (2013).30 TV S′ is a reliable tissue Doppler-derived marker of RV systolic function (Lang et al., 2015),6 while MPI reflects global ventricular performance by integrating systolic and diastolic time intervals.31 Thus, the present results support the view that RV dysfunction is a major component of septic cardiomyopathy that may not be captured by LV ejection fraction alone.
TAPSE/PASP ratio was the strongest echocardiographic predictor of mortality in this cohort. This finding agrees with Zhang et al. (2020) and Ma et al. (2024), who showed that RV–pulmonary arterial coupling has stronger prognostic value than TAPSE or PASP alone.32,33 The association is biologically plausible because sepsis can cause pulmonary hypertension and acute RV afterload mismatch; Vallabhajosyula et al. (2019) reported pulmonary hypertension in a substantial proportion of septic patients.34 In contrast to chronic pulmonary hypertension or advanced heart failure, where RV remodeling may develop gradually, acute sepsis may produce sudden RV–pulmonary arterial uncoupling with stronger short-term prognostic consequences.35
This study also highlights RV diastolic dysfunction. Tricuspid E/e′ was higher at baseline in non-survivors and increased over follow-up in both septic shock and non-survivor groups, suggesting rising RV filling pressures. This is consistent with Rolando et al. (2015), who reported that ventricular diastolic dysfunction independently predicted outcome in severe sepsis and septic shock.
This study has limitations. It was conducted in a single center with 50 patients, limiting statistical power and external validity. Echocardiographic indices such as TAPSE, MAPSE, TV S′, and MV S′ are angle-dependent and load-sensitive, and may be affected by fluid therapy, vasopressors, pulmonary pressures, and ventilator settings. Infection source, antimicrobial timing, cumulative fluid balance, vasopressor dose, and detailed ventilatory parameters were not fully analyzed. Finally, the observational design does not permit causal inference, and the findings should be considered hypothesis-supporting rather than definitive.
RV dysfunction might be associated with septic shock and short-term mortality. Among the evaluated parameters, the TAPSE/PASP ratio appears to be an independent echocardiographic predictor of mortality, while the diastolic shock index independently predicts septic shock. Serial RV-focused echocardiography may improve early risk stratification in septic patients, but larger multicenter studies are needed to validate these findings and define clinically actionable thresholds.
6. Competing interests
The authors declare that they have no competing interests.
7. Funding
None.
8. Authors' contribution
AAE contributed to study conception, patient recruitment, data collection, data analysis, interpretation of results, and manuscript drafting. AAH contributed to study supervision, study design, interpretation of results, and critical revision of the manuscript. TSG contributed to study supervision, echocardiographic interpretation, data interpretation, and critical revision of the manuscript. SAM contributed to study supervision, data interpretation, and critical revision of the manuscript. All authors read and approved the final manuscript.
9. Ethical approval
The study protocol was reviewed and approved by the Medical Research Ethics Committee, Institutional Review Board, Mansoura Faculty of Medicine, Mansoura University, Egypt. The approval letter was issued on 07 April 2024 under approval code MD.24.03.843. Written informed consent was obtained from all participants or from their legally authorized representatives when patients were unable to provide consent.
10. Availability of data
The datasets are available from the corresponding author upon reasonable request.
Authors affiliations:
- Ahmed A. El-Shimy. Department of Internal Medicine and Critical Care, Faculty of Medicine, Mansoura University, Mansoura, Egypt. E-mail: shimy9390@gmail.com
- Afaf Abdel Hafez. Department of Internal Medicine and Critical Care, Faculty of Medicine, Mansoura University, Mansoura, Egypt.
- Tarek El-Sayed Gouda. Department of Internal Medicine and Critical Care, Faculty of Medicine, Mansoura University, Mansoura, Egypt.
- Samar A. Mousa. Department of Internal Medicine and Critical Care, Faculty of Medicine, Mansoura University, Mansoura, Egypt.
ABSTRACT
Background: Sepsis-induced cardiac dysfunction (SICD) is common in sepsis and septic shock. Although traditionally focused on left ventricular dysfunction, right ventricular (RV) impairment may have important prognostic value. This study evaluated the relationship between RV performance and severity and outcome in sepsis and septic shock.
Methods: This prospective cohort study included 50 adults admitted to the Critical Care Medicine Unit, Mansoura University Hospitals, between June 2024 and June 2025 with sepsis or septic shock. Transthoracic echocardiography was performed within 12 hours of admission and repeated during follow-up for up to 7 days. RV assessment included tissue Doppler-derived tricuspid annular systolic velocity (TV S′), tricuspid E/e′ ratio, RV myocardial performance index (MPI), tricuspid annular plane systolic excursion (TAPSE), pulmonary artery systolic pressure (PASP), and TAPSE/PASP ratio. Patients were classified by sepsis severity and survival status. The primary outcome was in-hospital mortality; the secondary outcome was intensive care unit length of stay.
Results: Septic shock was associated with lower TAPSE (P = 0.015), TAPSE/PASP ratio (P = 0.003), and TV S′ (P = 0.009), and higher RV MPI (P = 0.001) and TV E/e′ (P = 0.007). Baseline TV S′, TAPSE, and TAPSE/PASP were comparable between survivors and non-survivors, but decreased significantly during follow-up in non-survivors (P = 0.001 for each). Non-survivors also showed increasing RV filling pressures, lactate, neutrophil-to-lymphocyte ratio, and troponin (P ≤ 0.005).
Conclusions: RV dysfunction, particularly reduced TAPSE/PASP ratio, lower TV S′, and higher RV MPI, provides clinically relevant prognostic information for septic shock progression and short-term mortality.
Keywords: Echocardiography; Myocardial performance index; Sepsis-induced cardiac dysfunction; Sepsis; Septic shock; Right ventricular dysfunction; Tissue Doppler imaging
Abbreviations: MPI: myocardial performance index, RV: right ventricular, SICD: Sepsis-induced cardiac dysfunction. TAPSE: tricuspid annular plane systolic excursion
Citation: El-Shimy AA, Hafez AA, Gouda TES, Mousa SA. Right ventricular functions in sepsis and septic shock: relation to risk stratification and short-term outcomes. Anaesth. pain intensive care 2026;30(3):669-683. DOI: 10.35975/apic.v30i6.3262
Received: May 14, 2026; Revised: June 10, 2026; Accepted: June 10, 2026
1. INTRODUCTION
Sepsis remains a major global health problem, affecting an estimated 48.9 million individuals annually and causing approximately 11 million deaths worldwide.1 Cardiovascular failure is a key determinant of prognosis in sepsis and septic shock.2 Sepsis-induced cardiac dysfunction (SICD) is an acute and potentially reversible myocardial dysfunction that occurs during sepsis in the absence of primary coronary artery disease. It results from inflammatory, oxidative, cellular, and hemodynamic mechanisms and may affect the left ventricle (LV), right ventricle (RV), or both.3,4
Bedside echocardiography is central to the evaluation of SICD because it permits repeated, non-invasive assessment of cardiac performance in critically ill patients.5 Transthoracic echocardiography (TTE), particularly when combined with tissue Doppler imaging (TDI), enables quantitative evaluation of RV function. Tricuspid annular systolic velocity (S′) reflects RV systolic performance, whereas the myocardial performance index (MPI) provides an integrated estimate of global RV systolic and diastolic function.6
Although RV dysfunction is increasingly recognized as a predictor of mortality in sepsis and septic shock, existing evidence is predominantly observational and heterogeneous with respect to definitions, timing of assessment, and outcome measures.7 Moreover, data from Egyptian intensive care populations remain limited. This is clinically relevant because local case mix, infection patterns, referral pathways, and resource availability may influence both cardiac involvement and short-term outcomes. Previous Egyptian evidence suggests that RV dysfunction is common and prognostically important in early sepsis; however, further evaluation using focused RV echocardiographic parameters remains warranted.8
In this prospective observational study, we aimed to assess RV function in Egyptian patients with sepsis and septic shock and to determine its association with risk stratification and short-term outcome. RV function was evaluated using TTE-derived TDI indices, including S′ and MPI. We hypothesized that RV dysfunction is associated with higher clinical risk and poorer short-term outcome.
2. METHODOLOGY
This prospective observational cohort study was conducted in the Critical Care Medicine Unit at the Specialized Medical Hospital, Mansoura University, Egypt, between June 2024 and July 2025. All eligible adult patients admitted to the intensive care unit (ICU) with sepsis or septic shock during the study period were prospectively screened for inclusion. The study was designed and reported in accordance with the Strengthening the Reporting of Observational Studies in Epidemiology (STROBE) statement for cohort studies.9 The study protocol was reviewed and approved by the Medical Research Ethics Committee, Institutional Review Board, Mansoura Faculty of Medicine, Mansoura University, Egypt. The approval letter was issued on 07 April 2024 under approval code (MD.24.03.843).
2.2. Study Population
The study included 50 adult patients admitted to the ICU with sepsis or septic shock. Patients were classified into two groups based on disease severity: sepsis and septic shock, according to the Sepsis-3 consensus definitions and the Surviving Sepsis Campaign 2021 guidelines.4,10 For outcome analysis, patients were further classified by in-hospital survival status as survivors or non-survivors. The primary analytical focus was the association between right ventricular echocardiographic parameters and both septic shock status and short-term mortality.
2.3. Diagnostic Definitions
Sepsis and septic shock were diagnosed according to the Surviving Sepsis Campaign 2021 guidelines and the Sepsis-3 consensus definitions. Sepsis was defined as life-threatening organ dysfunction caused by a dysregulated host response to infection. Septic shock was defined as a subset of sepsis characterized by persistent circulatory, cellular, and metabolic abnormalities, including the need for vasopressor therapy to maintain adequate mean arterial pressure and elevated serum lactate despite adequate fluid resuscitation, when applicable.4,10 The Surviving Sepsis Campaign recommends an initial mean arterial pressure target of 65 mmHg in adults with septic shock receiving vasopressors.4
Patients were eligible for inclusion if they were aged 18 years or older, admitted to the ICU with sepsis or septic shock, and had an adequate transthoracic echocardiographic assessment within 12 hours of ICU admission. Written informed consent was obtained from each patient or from a legally authorized representative when the patient was unable to provide consent, in accordance with the Declaration of Helsinki.11
Patients were excluded if they had any of the following: age below 18 years; acute coronary syndrome within the preceding week; established heart failure, defined as left ventricular ejection fraction less than 50% or grade III diastolic dysfunction; atrial fibrillation; prosthetic heart valves; severe mitral, aortic, or tricuspid valve stenosis or regurgitation; moderate to severe pulmonary hypertension; end-stage renal disease; documented substance abuse or addiction; pregnancy; inadequate echocardiographic acoustic window; or refusal to provide informed consent. These criteria were applied to reduce confounding from pre-existing cardiovascular, pulmonary vascular, rhythm-related, and renal conditions that could independently affect right ventricular structure, right ventricular loading conditions, or echocardiographic measurements.
The sample size was calculated using the single-population proportion formula:
n = Z² × P × (1 − P) / d²
where n is the required sample size, Z is the standard normal deviate at a 95% confidence level, P is the expected proportion of right ventricular dysfunction based on previous literature, and d is the accepted absolute precision.
Bendary et al. (2022)8 included 248 patients with sepsis and septic shock and reported that 48.4% of the study population had evidence of right ventricular dysfunction, either isolated or associated with left ventricular dysfunction. Therefore, the expected proportion was set at P = 0.484. Using a 95% confidence level (Z = 1.96) and an accepted absolute precision of 14% (d = 0.14), the required sample size was calculated as follows:
n = (1.96) ² × 0.484 × (1 − 0.484) / (0.14) ²
n = 3.8416 × 0.484 × 0.516 / 0.0196
n = 48.95
Thus, the minimum required sample size was approximately 49 patients, rounded up to 50. Accordingly, the final enrolled cohort of 50 patients was considered adequate for this prospective observational study.
Demographic and clinical data were collected prospectively. This included age, sex, residence, sepsis category, need for mechanical ventilation, ICU length of stay, and in-hospital survival status. Hemodynamic variables included mean arterial pressure, heart rate, diastolic blood pressure, diastolic shock index, and central venous oxygen saturation. The diastolic shock index was calculated as heart rate divided by diastolic blood pressure.
Severity of illness was assessed on intensive care unit admission using the Sequential Organ Failure Assessment (SOFA) score and the Acute Physiology and Chronic Health Evaluation II (APACHE II) score. The SOFA score was used to describe the degree of organ dysfunction/failure, while the APACHE II score was used as a severity-of-disease classification system for critically ill patients. Both scores were calculated on the day of admission and used for baseline clinical risk stratification. Mortality was recorded throughout hospitalization.12,13
Laboratory investigations were obtained at baseline and monitored during follow-up according to intensive care unit practice. The assessed laboratory variables included complete blood count with differential count, neutrophil-to-lymphocyte ratio (NLR), serum lactate, and cardiac troponin I. NLR was calculated by dividing the absolute neutrophil count by the absolute lymphocyte count and was used as an inflammatory marker in critically ill septic patients.14 Serum lactate was assessed as a marker of tissue hypoperfusion and metabolic stress; the Surviving Sepsis Campaign 2021 guidelines recommend using serum lactate to guide resuscitation in adults with sepsis or septic shock when lactate is elevated.4 Cardiac troponin I was measured as a marker of myocardial injury, as elevated troponin I has been associated with myocardial dysfunction, increased sepsis severity, and higher mortality in septic shock.15
All patients underwent bedside transthoracic echocardiography using a GE Vivid T8 cardiovascular ultrasound system (GE Healthcare, Wuxi, China). The first echocardiographic examination was performed within 12 hours of ICU admission. Follow-up echocardiography was repeated daily for a maximum of seven days when clinically feasible.
Echocardiographic examinations were performed by two experienced operators who were blinded to patients’ clinical data. Standard views were acquired, including parasternal long-axis, parasternal short-axis, apical four-chamber, and apical two-chamber views. Three consecutive cardiac cycles were measured and averaged for each parameter. Measurements with interobserver variability greater than 5% were excluded. Echocardiographic acquisition and interpretation followed the American Society of Echocardiography recommendations for right-heart assessment and cardiac chamber quantification.6,16,17
Right ventricular systolic function was assessed using a multiparametric approach, including tricuspid annular plane systolic excursion, tissue Doppler-derived tricuspid annular systolic velocity, right ventricular myocardial performance index, pulmonary artery systolic pressure, and the tricuspid annular plane systolic excursion/pulmonary artery systolic pressure ratio.
Tricuspid annular plane systolic excursion was measured by M-mode echocardiography in the apical four-chamber view, with the cursor aligned along the lateral tricuspid annulus. Tissue Doppler-derived tricuspid annular systolic velocity was obtained using pulsed-wave tissue Doppler imaging, with the sample volume positioned at the lateral tricuspid annulus. These parameters were selected because they provide feasible and reproducible bedside measures of right ventricular longitudinal systolic performance.6,16
Right ventricular myocardial performance index, also known as the Tei index, was calculated from tissue Doppler-derived time intervals. Isovolumetric contraction time, isovolumetric relaxation time, and ejection time were measured, and the right ventricular myocardial performance index was calculated as follows:
Right ventricular myocardial performance index = (isovolumetric contraction time + isovolumetric relaxation time) / ejection time
When tricuspid valve closure-to-opening time was used, right ventricular myocardial performance index was calculated as:
Right ventricular myocardial performance index = (tricuspid valve closure-to-opening time − ejection time) / ejection time
Right ventricular myocardial performance index was used as an index of global right ventricular performance because it incorporates both systolic and diastolic time intervals. Higher values indicate impaired global right ventricular function.16,17
Pulmonary artery systolic pressure was estimated from the peak tricuspid regurgitation velocity, when measurable, together with estimated right atrial pressure according to standard echocardiographic recommendations. The tricuspid annular plane systolic excursion/pulmonary artery systolic pressure ratio was calculated as an index of right ventricular–pulmonary arterial coupling. Lower values indicate impaired right ventricular adaptation to pulmonary arterial load and suggest right ventricular–pulmonary arterial uncoupling.
Right ventricular diastolic function was assessed using trans-tricuspid Doppler inflow and tissue Doppler-derived annular velocities. The measured parameters included tricuspid E velocity, tricuspid A velocity, tricuspid E/A ratio, tricuspid annular early diastolic velocity, and tricuspid E/e′ ratio. Tricuspid E/e′ was used as an estimate of right ventricular filling pressure according to standardized right-heart echocardiographic methodology.16,17
Left ventricular systolic function was evaluated using left ventricular ejection fraction, mitral annular plane systolic excursion, mitral annular systolic velocity, and left ventricular myocardial performance index. Left ventricular ejection fraction was calculated using the modified biplane Simpson’s method from apical four-chamber and apical two-chamber views, according to chamber quantification recommendations.6
Mitral annular plane systolic excursion was measured as the longitudinal systolic displacement of the mitral annulus. Mitral annular systolic velocity was obtained by pulsed-wave tissue Doppler imaging from the lateral mitral annulus. Left ventricular myocardial performance index was calculated from tissue Doppler-derived isovolumetric contraction time, isovolumetric relaxation time, and ejection time using the following formula:
Left ventricular myocardial performance index = (isovolumetric contraction time + isovolumetric relaxation time) / ejection time
Left ventricular diastolic function was assessed using transmitral Doppler inflow and tissue Doppler-derived mitral annular velocities. The measured parameters included mitral E velocity, mitral A velocity, mitral E/A ratio, mitral annular e′ velocity, and mitral E/e′ ratio. Mitral E/e′ was used as an echocardiographic estimate of left ventricular filling pressure, in accordance with recommendations for echocardiographic assessment of left ventricular diastolic function.18
The main exposure variables were right ventricular echocardiographic indices, including tricuspid annular systolic velocity, right ventricular myocardial performance index, tricuspid annular plane systolic excursion, pulmonary artery systolic pressure, tricuspid annular plane systolic excursion/pulmonary artery systolic pressure ratio, and tricuspid E/e′ ratio. Additional explanatory variables included age, sex, residence, mechanical ventilation status, Sequential Organ Failure Assessment score, Acute Physiology and Chronic Health Evaluation II score, mean arterial pressure, heart rate, diastolic shock index, central venous oxygen saturation, neutrophil-to-lymphocyte ratio, serum lactate, and troponin I.
The primary outcome was in-hospital mortality. The secondary outcome was ICU length of stay. Additional analyses evaluated the association between right ventricular echocardiographic parameters and septic shock status, as well as the relationship between serial changes in right ventricular parameters and short-term outcome.
Several measures were applied to reduce bias. Consecutive eligible patients were prospectively screened to reduce selection bias. Strict exclusion criteria were applied to minimize confounding from pre-existing heart failure, significant valvular disease, atrial fibrillation, pulmonary hypertension, and inadequate imaging windows. Echocardiographic measurements were performed by two experienced operators blinded to patients’ clinical data to reduce measurement and observer bias. Three consecutive cardiac cycles were averaged for each parameter, and measurements with Interobserver variability greater than 5% were xcluded. Standardized echocardiographic definitions and acquisition methods were used to improve reproducibility and external comparability.
2.1. Statistical Analysis
Statistical analysis was performed using IBM SPSS Statistics for Windows, version 31.0.1.0 (IBM Corp., Armonk, NY, USA). Continuous variables were expressed as mean ± standard deviation. Categorical variables were expressed as frequencies and percentages. The Student’s t-test was used to compare normally distributed continuous variables between two independent groups.
A total of 50 adult patients admitted to the intensive care unit with sepsis or septic shock were included in the final analysis. The mean age was 60.58 ± 12.31 years, and the cohort included 24 males (48%) and 26 females (52%). Thirteen patients (26%) had sepsis, whereas 37 patients (74%) had septic shock. Mechanical ventilation was required in 22 patients (44%). In-hospital mortality occurred in 20 patients (40%), outside-hospital mortality occurred in 3 patients (6%), and 27 patients (54%) were alive. The mean intensive care unit length of stay was 5.0 ± 1.7 days. Baseline clinical severity was high, with mean Sequential Organ Failure Assessment (SOFA) and Physiology and Chronic Health Evaluation II CHE II) scores of 10.2 ± 4.3 and 18.3 test was used to compare categorical variables. When parametric assumptions were not met, nonparametric tests, such as the Mann–Whitney U test, were used as appropriate. Comparisons were performed between patients with sepsis and patients with septic shock and between survivors and non-survivors. Serial changes in clinical, laboratory, and echocardiographic parameters were evaluated during follow-up and compared between groups. Multivariable logistic regression analysis was used to identify independent predictors of septic shock and short-term mortality. Variables with clinical relevance and those showing significant or near-significant associations in group comparisons were included in the regression models. Regression results were reported as regression coefficient, odds ratio, 95% confidence interval, and p-value. Receiver operating characteristic curve analysis was used to assess the discriminatory performance of predictive models for septic shock and mortality. Model performance was reported using the area under the curve, standard error, 95% confidence interval, sensitivity, specificity, and overall predictive accuracy. A two-sided p-value less than 0.05 was considered statistically significant.
3. RESULTS
Baseline echocardiography demonstrated preserved mean left ventricular ejection fraction (LVEF) of 57 ± 11%. Left ventricular myocardial performance index (LV MPI) was 0.63 ± 0.19, and mitral annular plane systolic excursion (MAPSE) was 13.0 ± 2.3 mm. Right ventricular assessment showed a mean tricuspid valve systolic velocity (TV S′) of 0.17 ± 0.05 m/s, right ventricular myocardial performance index (RV MPI) of 1.1 ± 0.5, pulmonary artery systolic pressure (PASP) of 30.0 ± 10.5 mmHg, tricuspid annular plane systolic excursion (TAPSE) of 18.0 ± 3.6 mm, and TAPSE/PASP ratio of 0.65 ± 0.19. Baseline echocardiographic parameters are summarized in Table 2.
| Table 1. Baseline demographic, clinical, and laboratory characteristics of the studied cohort | |
| Variable | Total cohort, n = 50 |
| Age, years | 60.58 ± 12.31 |
| Male sex | 24 (48%) |
| Female sex | 26 (52%) |
| Urban residence | 22 (44%) |
| Rural residence | 28 (56%) |
| Sepsis | 13 (26%) |
| Septic shock | 37 (74%) |
| Mechanical ventilation | 22 (44%) |
| Non-mechanical ventilation | 28 (56%) |
| In-hospital mortality | 20 (40%) |
| Outside-hospital mortality | 3 (6%) |
| Alive | 27 (54%) |
| ICU length of stay, days | 5.0 ± 1.7 |
| SOFA score | 10.2 ± 4.3 |
| APACHE II score | 18.3 ± 7.2 |
| MAP, mmHg | 80.9 ± 13.9 |
| Heart rate, beats/min | 110.2 ± 18.2 |
| DSI | 1.64 ± 0.52 |
| ScvO₂, % | 79.9 ± 7.5 |
| Lactate, mmol/L | 4.3 ± 1.6 |
| Troponin I, ng/mL | 0.22 ± 0.27 |
| Data are expressed as mean ± standard deviation or number (percentage). Troponin I was available in 36 patients. APACHE II, Acute Physiology and Chronic Health Evaluation II; DSI, diastolic shock index; ICU, intensive care unit; MAP, mean arterial pressure; ScvO₂, central venous oxygen saturation; SOFA, Sequential Organ Failure Assessment. | |
| Table 2. Baseline echocardiographic parameters of the studied cohort | |
| Parameter | Total cohort, n = 50 |
| LVEF, % | 57 ± 11 |
| LV MPI | 0.63 ± 0.19 |
| MAPSE, mm | 13.0 ± 2.3 |
| MV S′, m/s | 0.13 ± 0.04 |
| MV E, m/s | 0.55 ± 0.18 |
| MV A, m/s | 0.64 ± 0.16 |
| MV E/A ratio | 0.93 ± 0.46 |
| MV e′, m/s | 0.11 ± 0.02 |
| MV E/e′ ratio | 6.0 ± 2.7 |
| TV S′, m/s | 0.17 ± 0.05 |
| RV MPI | 1.1 ± 0.5 |
| PASP, mmHg | 30.0 ± 10.5 |
| TAPSE, mm | 18.0 ± 3.6 |
| TAPSE/PASP ratio | 0.65 ± 0.19 |
| TV E, m/s | 0.57 ± 0.15 |
| TV A, m/s | 0.65 ± 0.18 |
| TV E/A ratio | 0.88 ± 0.38 |
| TV e′, m/s | 0.13 ± 0.04 |
| TV E/e′ ratio | 5.1 ± 2.4 |
| Data are expressed as mean ± standard deviation. LV, left ventricular; LVEF, left ventricular ejection fraction; MAPSE, mitral annular plane systolic excursion; MPI, myocardial performance index; MV, mitral valve; PASP, pulmonary artery systolic pressure; RV, right ventricular; TAPSE, tricuspid annular plane systolic excursion; TV, tricuspid valve. |
|
| Table 3: Demographic data of the participants and the cardiovascular data | ||||||
| Male sex | — | — | — | 12 (44.4%) | 12 (52.2%) | χ² = 0.297, p = 0.777 |
| Female sex | — | — | — | 15 (55.6%) | 11 (47.8%) | χ² = 0.297, p = 0.777 |
| Urban residence | — | — | — | 12 (44.4%) | 10 (43.5%) | χ² = 0.005, p = 0.945 |
| Rural residence | — | — | — | 15 (55.6%) | 13 (56.5%) | χ² = 0.005, p = 0.945 |
| SOFA score | 6.85 ± 3.02 | 11.84 ± 4.78 | t = 3.51, p = 0.001* | 8.70 ± 3.23 | 13.20 ± 5.74 | t = 3.41, p = 0.001* |
| APACHE II score | 12.85 ± 5.24 | 21.24 ± 7.05 | t = 3.92, P < 0.001* | 16.33 ± 6.10 | 23.45 ± 7.21 | t = 3.65, p = 0.001* |
| MAP, mmHg, day 1 | 89.77 ± 13.82 | 76.27 ± 14.37 | t = 2.94, P = 0.005* | 84.33 ± 15.66 | 73.8 ± 13.60 | t = 2.41, P = 0.020* |
| MAP trajectory: increase | 7 (53.8%) | 19 (51.4%) | χ² = 0.024, P = 0.877 | 18 (66.7%) | 6 (26.1%) | χ² = 8.19, P = 0.004* |
| MAP trajectory: decrease | 6 (46.2%) | 18 (48.6%) | χ² = 0.024, P = 0.877 | 9 (33.3%) | 17 (73.9%) | χ² = 8.19, P = 0.004* |
| ScvO₂, %, day 1 | 75.31 ± 7.28 | 81.07 ± 6.56 | t = 2.65, P = 0.010* | 78.17 ± 7.60 | 81.23 ± 6.34 | t = 1.53, P = 0.132 |
| ScvO₂ trajectory: increase | 11 (84.6%) | 27 (73.0%) | χ² = 0.715, P = 0.398 | 24 (88.9%) | 14 (60.9%) | χ² = 5.35, P = 0.020* |
| ScvO₂ trajectory: decrease | 2 (15.4%) | 10 (27.0%) | χ² = 0.715, P = 0.398 | 3 (11.1%) | 9 (39.1%) | χ² = 5.35, P = 0.020* |
| DSI, day 1 | 1.31 ± 0.39 | 1.81 ± 0.45 | t = 3.54, P = 0.001* | 1.54 ± 0.45 | 1.88 ± 0.485 | t = 2.48, P = 0.017* |
| DSI trajectory: no change | 2 (15.4%) | 2 (5.4%) | χ² = 3.37, P = 0.185 | 3 (11.1%) | 1 (4.3%) | χ² = 18.49, P = 0.001* |
| DSI trajectory: increase | 9 (69.2%) | 20 (54.1%) | χ² = 3.37, P = 0.185 | 2 (7.4%) | 15 (65.2%) | χ² = 18.49, P = 0.001* |
| DSI trajectory: decrease | 2 (15.4%) | 15 (40.5%) | χ² = 3.37, P = 0.185 | 22 (81.5%) | 7 (30.4%) | χ² = 18.49, P = 0.001* |
| NLR, day 1 | 13.55 ± 6.64 | 16.87 ± 6.51 | t = 1.57, P = 0.122 | 15.55 ± 7.70 | 16.55 ± 5.25 | t = 0.527, P = 0.601 |
| NLR trajectory: increase | 1 (7.7%) | 28 (75.7%) | χ² = 18.25, P = 0.001* | 7 (25.9%) | 22 (95.7%) | χ² = 24.78, P = 0.001* |
| NLR trajectory: decrease | 12 (92.3%) | 9 (24.3%) | χ² = 18.25, P = 0.001* | 20 (74.1%) | 1 (4.3%) | χ² = 24.78, P = 0.001* |
| Lactate, mmol/L, day 1 | 3.53 ± 1.17 | 4.73 ± 1.67 | t = 1.95, P = 0.050* | 4.31 ± 1.65 | 4.54 ± 1.62 | t = 0.490, P = 0.626 |
| Lactate trajectory: no change | 1 (7.7%) | 0 | χ² = 4.39, P = 0.111 | 1 (3.7%) | 0 | χ² = 21.58, P = 0.001* |
| Lactate trajectory: increase | 5 (38.5%) | 23 (62.2%) | χ² = 4.39, P = 0.111 | 7 (25.9%) | 21 (91.3%) | χ² = 21.58, P = 0.001* |
| Lactate trajectory: decrease | 7 (53.8%) | 14 (37.8%) | χ² = 4.39, P = 0.111 | 19 (70.4%) | 2 (8.7%) | χ² = 21.58, P = 0.001* |
| Troponin I, ng/mL, day 1 | 0.103 ± 0.008 | 0.212 ± 0.27 | t = 0.976, P = 0.336 | 0.116 ± 0.03 | 0.25 ± 0.32 | t = 1.62, P = 0.113 |
| Troponin trajectory: no change | 1 (7.7%) | 3 (8.1%) | χ² = 10.59, P = 0.005* | 3 (11.1%) | 1 (4.3%) | χ² = 14.08, P = 0.001* |
| Troponin trajectory: increase | 5 (38.5%) | 30 (81.1%) | χ² = 10.59, P = 0.005* | 13 (48.1%) | 22 (95.7%) | χ² = 14.08, P = 0.001* |
| Troponin trajectory: decrease | 7 (53.8%) | 4 (10.8%) | χ² = 10.59, P = 0.005* | 11 (40.7%) | 0 | χ² = 14.08, P = 0.001* |
| Data are expressed as mean ± standard deviation or number (percentage). *Statistically significant at P < 0.05. A dash indicates that the variable was not reported for that comparison in the original manuscript table. APACHE II, Acute Physiology and Chronic Health Evaluation II; DSI, diastolic shock index; MAP, mean arterial pressure; NLR, neutrophil-to-lymphocyte ratio; ScvO₂, central venous oxygen saturation; SOFA, Sequential Organ Failure Assessment. | ||||||
| Table 4. Echocardiographic parameters according to sepsis severity | |||
| Variable | Sepsis (n = 13) | Septic shock, (n = 37) |
Test of significance |
| EF, %, day 1 | 58.85 ± 11.98 | 57.92 ± 10.32 | t = 0.267, P = 0.791 |
| EF trajectory: decrease | 7 (53.8%) | 7 (18.9%) | χ² = 5.82, P = 0.016* |
| EF trajectory: increase | 6 (46.2%) | 30 (81.1%) | χ² = 5.82, P = 0.016* |
| MV S′, m/s, day 1 | 0.125 ± 0.04 | 0.132 ± 0.03 | t = 0.556, P = 0.581 |
| MV S′ trajectory: no change | 1 (7.7%) | 1 (2.7%) | χ² = 7.75, P = 0.020* |
| MV S′ trajectory: decrease | 11 (84.6%) | 17 (45.9%) | χ² = 7.75, P = 0.020* |
| MV S′ trajectory: increase | 1 (7.7%) | 19 (51.4%) | χ² = 7.75, P = 0.020* |
| MV E/e′, day 1 | 5.91 ± 1.86 | 6.04 ± 3.38 | t = 0.131, P = 0.960 |
| MV E/e′ trajectory: no change | 1 (7.7%) | 2 (5.4%) | χ² = 2.61, P = 0.271 |
| MV E/e′ trajectory: decrease | 4 (30.8%) | 21 (56.8%) | χ² = 2.61, P = 0.271 |
| MV E/e′ trajectory: increase | 8 (61.5%) | 14 (37.8%) | χ² = 2.61, P = 0.271 |
| LV MPI, day 1 | 1.00 ± 0.45 | 1.05 ± 0.49 | t = 0.295, P = 0.769 |
| LV MPI trajectory: decrease | 1 (7.7%) | 19 (51.4%) | χ² = 7.64, P = 0.006* |
| LV MPI trajectory: increase | 12 (92.3%) | 18 (48.6%) | χ² = 7.64, P = 0.006* |
| MAPSE, mm, day 1 | 13.62 ± 2.25 | 12.92 ± 2.30 | t = 0.943, P = 0.350 |
| MAPSE trajectory: no change | 1 (7.7%) | 0 | χ² = 10.12, P = 0.006* |
| MAPSE trajectory: decrease | 10 (76.9%) | 14 (37.8%) | χ² = 10.12, P = 0.006* |
| MAPSE trajectory: increase | 2 (15.4%) | 23 (62.2%) | χ² = 10.12, P = 0.006* |
| TV S′, m/s, day 1 | 0.177 ± 0.04 | 0.176 ± 0.04 | t = 0.092, P = 0.927 |
| TV S′ trajectory: no change | 3 (23.1%) | 1 (2.7%) | χ² = 9.49, P = 0.009* |
| TV S′ trajectory: increase | 8 (61.5%) | 15 (40.5%) | χ² = 9.49, P = 0.009* |
| TV S′ trajectory: decrease | 2 (15.4%) | 21 (56.8%) | χ² = 9.49, P = 0.009* |
| TV E/e′, day 1 | 4.45 ± 1.28 | 5.09 ± 3.05 | t = 0.744, P = 0.460 |
| TV E/e′ trajectory: no change | 0 | 2 (5.4%) | χ² = 10.01, P = 0.007* |
| TV E/e′ trajectory: increase | 5 (38.5%) | 29 (78.4%) | χ² = 10.01, p = 0.007* |
| TV E/e′ trajectory: decrease | 8 (61.5%) | 6 (16.2%) | χ² = 10.01, P = 0.007* |
| RV MPI, day 1 | 0.929 ± 0.40 | 1.10 ± 0.54 | t = 1.05, P = 0.301 |
| RV MPI trajectory: no change | 0 | 1 (2.7%) | χ² = 13.12, P = 0.001* |
| RV MPI trajectory: increase | 2 (15.4%) | 26 (70.3%) | χ² = 13.12, P = 0.001* |
| RV MPI trajectory: decrease | 11 (84.6%) | 10 (27.0%) | χ² = 13.12, P = 0.001* |
| TAPSE, mm, day 1 | 18.15 ± 2.73 | 18.16 ± 4.07 | t = 0.007, P = 0.995 |
| TAPSE trajectory: no change | 1 (7.7%) | 1 (2.7%) | χ² = 8.46, P = 0.015* |
| TAPSE trajectory: increase | 10 (76.9%) | 13 (35.1%) | χ² = 8.46, P = 0.015* |
| TAPSE trajectory: decrease | 2 (15.4%) | 23 (62.2%) | χ² = 8.46, P = 0.015* |
| TAPSE/PASP, day 1 | 0.726 ± 0.16 | 0.621 ± 0.21 | t = 1.65, P = 0.105 |
| TAPSE/PASP trajectory: increase | 7 (53.8%) | 5 (13.5%) | χ² = 8.58, P = 0.003* |
| TAPSE/PASP trajectory: decrease | 6 (46.2%) | 32 (86.5%) | χ² = 8.58, P = 0.003* |
| Data are expressed as mean ± standard deviation or number (percentage). *Statistically significant at P < 0.05. EF, ejection fraction; LV, left ventricular; MAPSE, mitral annular plane systolic excursion; MPI, myocardial performance index; MV, mitral valve; PASP, pulmonary artery systolic pressure; RV, right ventricular; TAPSE, tricuspid annular plane systolic excursion; TV, tricuspid valve. | |||
| Table 5. Echocardiographic parameters according to survival status | |||
| Variable | Alive, n = 27 | Death, n = 23 | Test of significance |
| EF, %, day 1 | 58.51 ± 11.85 | 57.90 ± 9.98 | t = 0.189, P = 0.851 |
| EF trajectory: decrease | 14 (51.9%) | 0 | χ² = 16.56, P = 0.001* |
| EF trajectory: increase | 13 (48.1%) | 23 (100%) | χ² = 16.56, P = 0.001* |
| MV S′, m/s, day 1 | 0.130 ± 0.03 | 0.133 ± 0.03 | t = 0.277, P = 0.783 |
| MV S′ trajectory: no change | 2 (7.4%) | 0 | χ² = 20.75, P = 0.001* |
| MV S′ trajectory: decrease | 22 (81.5%) | 6 (26.1%) | χ² = 20.75, P = 0.001* |
| MV S′ trajectory: increase | 3 (11.1%) | 17 (73.9%) | χ² = 20.75, P = 0.001* |
| MV E/e′, day 1 | 5.17 ± 1.83 | 7.16 ± 4.11 | t = 2.24, P = 0.030* |
| MV E/e′ trajectory: no change | 1 (3.7%) | 2 (8.7%) | χ² = 5.59, P = 0.061 |
| MV E/e′ trajectory: decrease | 10 (37.0%) | 15 (65.2%) | χ² = 5.59, P = 0.061 |
| MV E/e′ trajectory: increase | 16 (59.3%) | 6 (26.1%) | χ² = 5.59, P = 0.061 |
| LV MPI, day 1 | 0.919 ± 0.41 | 1.22 ± 0.55 | t = 2.09, P = 0.042* |
| LV MPI trajectory: decrease | 2 (7.4%) | 18 (78.3%) | χ² = 25.98, P = 0.001* |
| LV MPI trajectory: increase | 25 (92.6%) | 5 (21.7%) | χ² = 25.98, P = 0.001* |
| MAPSE, mm, day 1 | 13.41 ± 2.41 | 12.85 ± 2.18 | t = 0.816, P = 0.419 |
| MAPSE trajectory: no change | 1 (3.7%) | 0 | χ² = 35.51, P = 0.001* |
| MAPSE trajectory: decrease | 23 (85.2%) | 1 (4.3%) | χ² = 35.51, P = 0.001* |
| MAPSE trajectory: increase | 3 (11.1%) | 22 (95.7%) | χ² = 35.51, P = 0.001* |
| TV S′, m/s, day 1 | 0.174 ± 0.036 | 0.185 ± 0.04 | t = 0.845, P = 0.402 |
| TV S′ trajectory: no change | 3 (11.1%) | 1 (4.3%) | χ² = 17.92, P = 0.001* |
| TV S′ trajectory: increase | 19 (70.4%) | 4 (17.4%) | χ² = 17.92, P = 0.001* |
| TV S′ trajectory: decrease | 5 (18.5%) | 18 (78.3%) | χ² = 17.92, P = 0.001* |
| TV E/e′, day 1 | 4.14 ± 1.19 | 6.05 ± 3.82 | t = 2.44, P = 0.019* |
| TV E/e′ trajectory: no change | 2 (7.4%) | 0 | χ² = 10.77, P = 0.005* |
| TV E/e′ trajectory: increase | 13 (48.1%) | 21 (91.3%) | χ² = 10.77, P = 0.005* |
| TV E/e′ trajectory: decrease | 12 (44.4%) | 2 (8.7%) | χ² = 10.77, P = 0.005* |
| RV MPI, day 1 | 0.897 ± 0.38 | 1.27 ± 0.62 | t = 2.56, P = 0.014* |
| RV MPI trajectory: no change | 1 (3.7%) | 0 | χ² = 27.19, P = 0.001* |
| RV MPI trajectory: increase | 6 (22.2%) | 22 (95.7%) | χ² = 27.19, P = 0.001* |
| RV MPI trajectory: decrease | 20 (74.1%) | 1 (4.3%) | χ² = 27.19, P = 0.001* |
| TAPSE, mm, day 1 | 18.37 ± 3.69 | 18.0 ± 4.07 | t = 0.325, P = 0.746 |
| TAPSE trajectory: no change | 1 (3.7%) | 0 | χ² = 35.51, P = 0.001* |
| TAPSE trajectory: increase | 23 (85.2%) | 1 (4.3%) | χ² = 35.51, P = 0.001* |
| TAPSE trajectory: decrease | 3 (11.1%) | 22 (95.7%) | χ² = 35.51, P = 0.001* |
| TAPSE/PASP, day 1 | 0.725 ± 0.14 | 0.543 ± 0.24 | t = 2.48, P = 0.060 |
| TAPSE/PASP trajectory: increase | 12 (44.4%) | 0 | χ² = 13.45, P = 0.001* |
| TAPSE/PASP trajectory: decrease | 15 (55.6%) | 23 (100%) | χ² = 13.45, P = 0.001* |
| Data are expressed as mean ± standard deviation or number (percentage). *Statistically significant at p < 0.05. EF, ejection fraction; LV, left ventricular; MAPSE, mitral annular plane systolic excursion; MPI, myocardial performance index; MV, mitral valve; PASP, pulmonary artery systolic pressure; RV, right ventricular; TAPSE, tricuspid annular plane systolic excursion; TV, tricuspid valve. | |||
Patients with septic shock had significantly higher SOFA and APACHE II scores than patients with sepsis. On day 1, mean arterial pressure (MAP) was significantly lower in patients with septic shock, whereas ScvO₂ and diastolic shock index (DSI) were significantly higher. Baseline neutrophil-to-lymphocyte
For survival analysis, patients were classified as alive (n = 27) or death (n = 23), following the grouping reported in the manuscript tables. Baseline age, sex, and residence did not differ significantly between groups. Non-survivors had significantly higher SOFA and APACHE II scores, lower day-1 MAP, and higher day-1 DSI. Baseline NLR, lactate, and troponin I were not significantly different between survivors and non-survivors; however, their trajectories increased significantly in non-survivors. Echocardiographically,
In the multivariable logistic regression model for septic shock, DSI was the only statistically significant independent predictor, with an odds ratio of 11.952 and 95% confidence interval of 1.429–99.955. ScvO₂, TAPSE, and TAPSE/PASP approached statistical significance but did not reach the predefined threshold. The receiver operating characteristic (ROC) analysis for the septic shock prediction model showed an area under the curve (AUC) of 0.902, with sensitivity of 81.1%, specificity of 84.6%, and overall prediction of 78%. For short-term mortality, TAPSE/PASP ratio was the only statistically significant independent predictor, with an odds ratio of 0.007 and 95% confidence interval of 0.000–0.432. RV MPI approached statistical significance. The mortality prediction model showed an AUC of 0.816, with sensitivity of 73.9%, specificity of 85.2%, and overall prediction of 76%. Regression and ROC results are summarized in Table 6.
| Table 6. Multivariable logistic regression and ROC analysis for prediction of septic shock and mortality | |||||||||||
| Analysis | Predictor /model | β | Odds ratio | 95% CI lower | 95% CI upper | AUC | Standard error | Overall prediction | Sensit-ivity | Specif-icity | p-value |
| Logistic regression: septic shock | ScvO₂ | 0.139 | 1.149 | 0.997 | 1.325 | — | — | — | — | — | 0.055 |
| Logistic regression: septic shock | DSI | 2.481 | 11.952 | 1.429 | 99.955 | — | — | — | — | — | 0.022* |
| Logistic regression: septic shock | Lactate | 0.619 | 1.858 | 0.852 | 4.051 | — | — | — | — | — | 0.119 |
| Logistic regression: septic shock | RV MPI | 0.265 | 1.303 | 0.100 | 17.056 | — | — | — | — | — | 0.840 |
| Logistic regression: septic shock | TV S′ | −8.160 | 0.000 | 0.000 | 1,141,775, 989.441 | — | — | — | — | — | 0.581 |
| Logistic regression: septic shock | TAPSE | 0.323 | 1.381 | 0.945 | 2.017 | — | — | — | — | — | 0.095 |
| Logistic regression: septic shock | TAPSE/PASP | −5.668 | 0.003 | 0.000 | 1.529 | — | — | — | — | — | 0.068 |
| Logistic regression: septic shock | Constant | −16.901 | 0.000 | — | — | — | — | — | — | — | 0.025* |
| ROC analysis: septic shock | Predictive model | — | — | 0.819 | 0.985 | 0.902 | 0.042 | 78% | 81.1% | 84.6% | 0.001* |
| Logistic regression: mortality | ScvO₂ | 0.056 | 1.057 | 0.949 | 1.178 | — | — | — | — | — | 0.311 |
| Logistic regression: mortality | DSI | 0.933 | 2.541 | 0.443 | 14.580 | — | — | — | — | — | 0.295 |
| Logistic regression: mortality | Lactate | 0.018 | 1.018 | 0.630 | 1.645 | — | — | — | — | — | 0.943 |
| Logistic regression: mortality | RV MPI | 2.182 | 8.866 | 0.981 | 80.114 | — | — | — | — | — | 0.052 |
| Logistic regression: mortality | TV S′ | 19.385 | 262,330,179.593 | 0.000 | 148,334,031, 646,575,820, 000.000 | — | — | — | — | — | 0.160 |
| Logistic regression: mortality | TAPSE | 0.098 | 1.103 | 0.840 | 1.448 | — | — | — | — | — | 0.480 |
| Logistic regression: mortality | TAPSE/PASP | −4.935 | 0.007 | 0.000 | 0.432 | — | — | — | — | — | 0.018* |
| Logistic regression: mortality | Constant | −10.475 | 0.000 | — | — | — | — | — | — | — | 0.068 |
| ROC analysis: mortality | Predictive model | — | — | 0.690 | 0.943 | 0.816 | 0.065 | 76% | 73.9% | 85.2% | 0.001* |
| Logistic regression data are expressed as β coefficient, odds ratio, 95% confidence interval, and p-value. ROC data are expressed as area under the curve, standard error, 95% confidence interval, overall prediction, sensitivity, specificity, and p-value. *Statistically significant at P < 0.05. Very wide confidence intervals for TV S′ reflect model instability and should be interpreted cautiously. AUC, area under the receive operating characteristic curve; CI, confidence interval; DSI, diastolic shock index; MPI, myocardial performance index; PASP, pulmonary artery systolic pressure; ROC, receiver operating characteristic; RV, right ventricular; scvo₂, central venous oxygen saturation; TAPSE, tricuspid annular plane systolic excursion; TV, tricuspid valve. | |||||||||||
The right ventricular-focused apical four-chamber view used for pulsed tissue Doppler assessment of the lateral tricuspid annulus. This view was used to measure myocardial systolic velocity (S′), which reflects right ventricular longitudinal systolic performance (Figure 1). The tissue Doppler imaging-derived myocardial performance index of the right ventricle. Time 1 represents tricuspid valve closure-to-opening time, and time 2 represents ejection time. In the presented example, MPI was calculated as (349 − 156)/156 = 1.2 (Figure 2).
Figure 1: RV-Focused A4C view showing measurement of myocardial systolic velocity (S′) by pulsed tissue Doppler of the lateral tricuspid annulus
Figure 2: Tissue Doppler imaging (TDI)–derived myocardial performance index (MPI, Tei index) of the right ventricle. Time intervals were measured using TDI: time 1 represents tricuspid valve closure‑to‑opening (TCO), and time 2 represents ejection time (ET). MPI was calculated as (TCO – ET)/ET. In this patient, MPI = (349 – 156)/156 = 1.2.
4. DISCUSSION
The main findings were threefold. First, baseline echocardiographic parameters within the first 12 hours were largely comparable between sepsis and septic shock, but serial follow-up over a maximum of seven days revealed a divergent pattern: septic shock and non-survival were associated with dynamic augmentation of LV systolic indices alongside deterioration of RV systolic indices. Second, serial changes in neutrophil-to-lymphocyte ratio (NLR), lactate, and troponin were more prognostically informative than isolated admission values. Third, diastolic shock index (DSI) was the only independent predictor of septic shock, whereas lower tricuspid annular plane systolic excursion/pulmonary artery systolic pressure (TAPSE/PASP) ratio was the only independent predictor of short-term mortality.
Non-survivors had significantly higher Acute Physiology and Chronic Health Evaluation II (APACHE II) and Sequential Organ Failure Assessment (SOFA) scores on admission, supporting their established role as severity and mortality assessment tools in critically ill patients.19 However, these scores did not independently predict septic shock in this cohort, possibly because they reflect established organ dysfunction rather than the hyperacute hemodynamic transition from sepsis to septic shock.20 In contrast, DSI may better capture early circulatory instability because it integrates tachycardia and reduced diastolic pressure.
Admission NLR, lactate, and troponin did not consistently discriminate survivors from non-survivors; however, progressive increases in all three markers during follow-up were strongly associated with mortality. This supports the concept that kinetic biomarker assessment provides greater short-term prognostic resolution than single baseline measurements. These findings are consistent with Alataby et al. (2021), Mungan et al. (2026), and Jendoubi et al. (2019), who emphasized the prognostic importance of dynamic lactate and troponin trajectories in sepsis and critical illness.21,22
The most important finding was the association between RV dysfunction and poor outcome. Patients with septic shock and non-survivors showed deterioration in RV systolic indices, including TAPSE, tricuspid annular systolic velocity (TV S′), TAPSE/PASP ratio, and RV myocardial performance index (RV MPI). This agrees with Koowattanatianchai et al. (2025), Lanspa et al. (2021), and Bendary et al. (2022), who reported that RV impairment is associated with short-term mortality in sepsis and septic shock.8,23,24 However, Agarwal et al. (2025) reported that RV dysfunction may lose independent prognostic significance after adjustment, highlighting the influence of population characteristics, timing of echocardiography, and RV dysfunction definitions.25
Sepsis-induced cardiac dysfunction is not confined to the LV. Reduced systemic vascular resistance may lower LV afterload and preserve or augment LV systolic indices, whereas acute lung injury, pulmonary vasoconstriction, hypoxia, hypercapnia, positive-pressure ventilation, and pulmonary microvascular obstruction increase RV afterload (Asllanaj et al., 2023; Guazzi and Labate, 2016; Murphy and Shelley, 2019). Because the RV has limited tolerance to abrupt afterload elevation, RV dysfunction may appear before overt LV systolic impairment becomes evident.24 Mechanistically, increased pulmonary vascular resistance, reduced nitric oxide availability, platelet–leukocyte aggregation, septal displacement, reduced LV filling, and increased RV oxygen demand may contribute to RV–pulmonary arterial uncoupling and circulatory failure.26-29
The observed increase in RV MPI and reduction in TV S′ among patients with shock and non-survivors are consistent with Harmankaya et al. (2013).30 TV S′ is a reliable tissue Doppler-derived marker of RV systolic function (Lang et al., 2015),6 while MPI reflects global ventricular performance by integrating systolic and diastolic time intervals.31 Thus, the present results support the view that RV dysfunction is a major component of septic cardiomyopathy that may not be captured by LV ejection fraction alone.
TAPSE/PASP ratio was the strongest echocardiographic predictor of mortality in this cohort. This finding agrees with Zhang et al. (2020) and Ma et al. (2024), who showed that RV–pulmonary arterial coupling has stronger prognostic value than TAPSE or PASP alone.32,33 The association is biologically plausible because sepsis can cause pulmonary hypertension and acute RV afterload mismatch; Vallabhajosyula et al. (2019) reported pulmonary hypertension in a substantial proportion of septic patients.34 In contrast to chronic pulmonary hypertension or advanced heart failure, where RV remodeling may develop gradually, acute sepsis may produce sudden RV–pulmonary arterial uncoupling with stronger short-term prognostic consequences.35
This study also highlights RV diastolic dysfunction. Tricuspid E/e′ was higher at baseline in non-survivors and increased over follow-up in both septic shock and non-survivor groups, suggesting rising RV filling pressures. This is consistent with Rolando et al. (2015), who reported that ventricular diastolic dysfunction independently predicted outcome in severe sepsis and septic shock.
This study has limitations. It was conducted in a single center with 50 patients, limiting statistical power and external validity. Echocardiographic indices such as TAPSE, MAPSE, TV S′, and MV S′ are angle-dependent and load-sensitive, and may be affected by fluid therapy, vasopressors, pulmonary pressures, and ventilator settings. Infection source, antimicrobial timing, cumulative fluid balance, vasopressor dose, and detailed ventilatory parameters were not fully analyzed. Finally, the observational design does not permit causal inference, and the findings should be considered hypothesis-supporting rather than definitive.
5. CONCLUSIONS
RV dysfunction might be associated with septic shock and short-term mortality. Among the evaluated parameters, the TAPSE/PASP ratio appears to be an independent echocardiographic predictor of mortality, while the diastolic shock index independently predicts septic shock. Serial RV-focused echocardiography may improve early risk stratification in septic patients, but larger multicenter studies are needed to validate these findings and define clinically actionable thresholds.
6. Competing interests
The authors declare that they have no competing interests.
7. Funding
None.
8. Authors' contribution
AAE contributed to study conception, patient recruitment, data collection, data analysis, interpretation of results, and manuscript drafting. AAH contributed to study supervision, study design, interpretation of results, and critical revision of the manuscript. TSG contributed to study supervision, echocardiographic interpretation, data interpretation, and critical revision of the manuscript. SAM contributed to study supervision, data interpretation, and critical revision of the manuscript. All authors read and approved the final manuscript.
9. Ethical approval
The study protocol was reviewed and approved by the Medical Research Ethics Committee, Institutional Review Board, Mansoura Faculty of Medicine, Mansoura University, Egypt. The approval letter was issued on 07 April 2024 under approval code MD.24.03.843. Written informed consent was obtained from all participants or from their legally authorized representatives when patients were unable to provide consent.
10. Availability of data
The datasets are available from the corresponding author upon reasonable request.
11. REFERENCES
- GBD 2021 Global Sepsis Collaborators. Global, regional, and national sepsis incidence and mortality, 1990-2021: a systematic analysis. Lancet Glob Health. 2025;13(12):e2013-e2026. PMID: 41135560 DOI: 10.1016/S2214-109X(25)00356-0
- Hollenberg SM, Singer M. Pathophysiology of sepsis-induced cardiomyopathy. Nat Rev Cardiol. 2021;18(6):424-434. PMID: 33473203 DOI: 10.1038/s41569-020-00492-2
- Geri G, Vignon P, Aubry A, Fedou AL, Charron C, Silva S, et al. Cardiovascular clusters in septic shock combining clinical and echocardiographic parameters: a post hoc analysis. Intensive Care Med. 2019;45(5):657-667. PMID: 30888443 DOI: 10.1007/s00134-019-05596-z
- Evans L, Rhodes A, Alhazzani W, Antonelli M, Coopersmith CM, French C, et al. Surviving sepsis campaign: international guidelines for management of sepsis and septic shock 2021. Intensive Care Med. 2021;47(11):1181-1247. PMCID: PMC8486643 DOI: 10.1007/s00134-021-06506-y
- Ehrman RR, Sullivan AN, Favot MJ, Sherwin RL, Reynolds CA, Abidov A, et al. Pathophysiology, echocardiographic evaluation, biomarker findings, and prognostic implications of septic cardiomyopathy: a review of the literature. Crit Care. 2018;22(1):112. PMCID: PMC5934857 DOI: 10.1186/s13054-018-2043-8
- Lang RM, Badano LP, Mor-Avi V, Afilalo J, Armstrong A, Ernande L, et al. Recommendations for cardiac chamber quantification by echocardiography in adults: an update from the American Society of Echocardiography and the European Association of Cardiovascular Imaging. J Am Soc Echocardiogr. 2015;28(1):1-39.e14. PMID: 25559473 DOI: 10.1016/j.echo.2014.10.003
- Vallabhajosyula S, Shankar A, Vojjini R, Cheungpasitporn W, Sundaragiri PR, DuBrock HM, et al. Impact of Right Ventricular Dysfunction on Short-term and Long-term Mortality in Sepsis: A Meta-analysis of 1,373 Patients. Chest. 2021;159(6):2254-2263. PMCID: PMC8579312 DOI: 10.1016/j.chest.2020.12.016
- Bendary A, Said H, Elemary M, Mahrous M. Right ventricular function as a predictor of short-term mortality in patients with sepsis and septic shock: an observational study. Egypt Heart J. 2022;74(1):78. PMCID: PMC9584025 DOI: 10.1186/s43044-022-00316-3
- von Elm E, Altman DG, Egger M, Pocock SJ, Gøtzsche PC, Vandenbroucke JP, et al. The Strengthening the Reporting of Observational Studies in Epidemiology (STROBE) statement: guidelines for reporting observational studies. BMJ. 2007;335(7624):806-8. PMCID: PMC2034723 DOI: 10.1136/bmj.39335.541782.AD
- Singer M, Deutschman CS, Seymour CW, Shankar-Hari M, Annane D, Bauer M, et al. The Third International Consensus Definitions for Sepsis and Septic Shock (Sepsis-3). JAMA. 2016;315(8):801-10. PMCID: PMC4968574 DOI: 10.1001/jama.2016.0287
- Ashcroft, R.E., The declaration of Helsinki. The Oxford textbook of clinical research ethics, New York: Oxford University Press. 2008;21:141-148. DOI: 10.1093/oso/9780195168655.003.0014
- Vincent JL, Moreno R, Takala J, Willatts S, De Mendonça A, Bruining H, et al. The SOFA (Sepsis-related Organ Failure Assessment) score to describe organ dysfunction/failure. On behalf of the Working Group on Sepsis-Related Problems of the European Society of Intensive Care Medicine. Intensive Care Med. 1996;22(7):707-10. PMID: 8844239 DOI: 10.1007/BF01709751
- Knaus WA, Draper EA, Wagner DP, Zimmerman JE. APACHE II: a severity of disease classification system. Crit Care Med. 1985;13(10):818-29. PMID: 3928249
- Drăgoescu AN, Pădureanu V, Stănculescu AD, Chiuțu LC, Tomescu P, Geormăneanu C, et al. Neutrophil to lymphocyte ratio (NLR)—a useful tool for the prognosis of sepsis in the ICU. Biomedicines. 2021;10(1):75. PMCID: PMC8772781 DOI: 10.3390/biomedicines10010075
- Mehta NJ, Khan IA, Gupta V, Jani K, Gowda RM, Smith PR. Cardiac troponin I predicts myocardial dysfunction and adverse outcome in septic shock. Int J Cardiol. 2004;95(1):13-17. PMID: 15159036 DOI: 10.1016/j.ijcard.2003.05.028
- Rudski LG, Lai WW, Afilalo J, Hua L, Handschumacher MD, Chandrasekaran K, et al. Guidelines for the echocardiographic assessment of the right heart in adults: a report from the American Society of Echocardiography endorsed by the European Association of Echocardiography, a registered branch of the European Society of Cardiology, and the Canadian Society of Echocardiography. J Am Soc Echocardiogr. 2010;23(7):685-713; quiz 786-8. PMID: 20620859 DOI: 10.1016/j.echo.2010.05.010
- Mukherjee M, Rudski LG, Addetia K, Afilalo J, D'Alto M, Freed BH, et al Guidelines for the Echocardiographic Assessment of the Right Heart in Adults and Special Considerations in Pulmonary Hypertension: Recommendations from the American Society of Echocardiography. J Am Soc Echocardiogr. 2025;38(3):141-186. PMID: 40044341 DOI: 10.1016/j.echo.2025.01.006
- Nagueh SF, Smiseth OA, Appleton CP, Byrd BF 3rd, Dokainish H, Edvardsen T, et al. Recommendations for the Evaluation of Left Ventricular Diastolic Function by Echocardiography: An Update from the American Society of Echocardiography and the European Association of Cardiovascular Imaging. J Am Soc Echocardiogr. 2016;29(4):277-314. PMID: 27037982 DOI: 10.1016/j.echo.2016.01.011
- Do SN, Dao CX, Nguyen TA, Nguyen MH, Pham DT, Nguyen NT, et al. Sequential Organ Failure Assessment (SOFA) Score for predicting mortality in patients with sepsis in Vietnamese intensive care units: a multicentre, cross-sectional study. BMJ Open. 2023;13(3):e064870. PMCID: PMC10016261 DOI: 10.1136/bmjopen-2022-064870
- Yildrim S, Kirakli C. Accuracy of conventional disease severity scores in predicting COVID-19 ICU mortality: retrospective single-center study in Turkey. Ann Saudi Med. 2022;42(6):408-414. PMCID: PMC9706719DOI: 10.5144/0256-4947.2022.408
- Alataby H, Nfonoyim J, Diaz K, Al-Tkrit A, Akhter S, David S, et al. The Levels of Lactate, Troponin, and N-Terminal Pro-B-Type Natriuretic Peptide Are Predictors of Mortality in Patients with Sepsis and Septic Shock: A Retrospective Cohort Study. Med Sci Monit Basic Res. 2021;27:e927834. PMCID: PMC7863562 DOI: 10.12659/MSMBR.927834
- Jendoubi A, Jerbi S, Maamar E, Abbess A, Samoud Z, Kanzari L, et al. Prognostic Value of High-sensitivity Troponin I in Patients with Septic Shock: A Prospective Observational Study. Indian J Crit Care Med. 2019;23(7):320-325. PMCID: PMC6686578 DOI: 10.5005/jp-journals-10071-23206
- Koowattanatianchai S, Kochaiyapatana P, Eungsuwat N, Rangsrisaeneepitak V, Thammakumpee K, Kaladee K. Significance of Right Ventricular Dysfunction in Predicting Short-Term Survival Among Patients With Sepsis and Septic Shock: A Prognostic Analysis. Crit Care Res Pract. 2025;2025:5511135. PMCID: PMC11928220 DOI: 10.1155/ccrp/5511135
- Lanspa MJ, Cirulis MM, Wiley BM, Olsen TD, Wilson EL, Beesley SJ, et al., Right Ventricular Dysfunction in Early Sepsis and Septic Shock. Chest. 2021;159(3):1055-1063. PMCID: PMC7965651 DOI: 10.1016/j.chest.2020.09.274
- Agarwal R, Yakkali S, Shah P, Vyas R, Kushwaha A, Krishnan A, et al. Predictors and Outcomes of Right Ventricular Dysfunction in Patients Admitted to the Medical Intensive Care Unit for Sepsis-A Retrospective Cohort Study. J Clin Med. 2025;14(15):5423. PMCID: PMC12347688 DOI: 10.3390/jcm14155423
- Spapen H, Vincken W. Pulmonary arterial hypertension in sepsis and the adult respiratory distress syndrome. Acta Clin Belg. 1992;47(1):30-41. PMID: 1317081 DOI: 10.1080/17843286.1992.11718207
- Redl G, Germann P, Plattner H, Hammerle A. Right ventricular function in early septic shock states. Intensive Care Med. 1993;19(1):3-7. PMID: 8440795 DOI: 10.1007/BF01709270
- Ventetuolo CE, Klinger JR. Management of acute right ventricular failure in the intensive care unit. Ann Am Thorac Soc. 2014;11(5):811-22. PMCID: PMC4225807 DOI: 10.1513/AnnalsATS.201312-446FR
- Petit M, Jullien E, Vieillard-Baron A. Right Ventricular Function in Acute Respiratory Distress Syndrome: Impact on Outcome, Respiratory Strategy and Use of Veno-Venous Extracorporeal Membrane Oxygenation. Front Physiol. 2022;12:797252. PMCID:PMC8795709 DOI: 10.3389/fphys.2021.797252
- Harmankaya A, Akilli H, Gul M, Akilli NB, Ergin M, Aribas A, et al. Assessment of right ventricular functions in patients with sepsis, severe sepsis and septic shock and its prognostic importance: a tissue Doppler study. J Crit Care. 2013;28(6):1111.e7-1111.e11. PMID: 24011976 DOI: 10.1016/j.jcrc.2013.07.059
- Nizamuddin J, Mahmood F, Tung A, Mueller A, Brown SM, Shaefi S, et al. Interval Changes in Myocardial Performance Index Predict Outcome in Severe Sepsis. J Cardiothorac Vasc Anesth. 2017;31(3):957-964. PMID: 28094172 DOI: 10.1053/j.jvca.2016.11.007
- Zhang H, Lian H, Zhang Q, Chen X, Wang X, Liu D. Prognostic implications of tricuspid annular plane systolic excursion/pulmonary arterial systolic pressure ratio in septic shock patients. Cardiovasc Ultrasound. 2020;18(1):20. PMCID: PMC7293130DOI: 10.1186/s12947-020-00198-y
- Ma Q, Ding C, Wei W, Su C, Li B, Zhou Z, et al.The value of right ventricular pulmonary artery coupling in determining the prognosis of patients with sepsis. Sci Rep. 2024;14(1):15283. PMCID: PMC11222489 DOI: 10.1038/s41598-024-65738-2
- Vallabhajosyula S, Geske JB, Kumar M, Kashyap R, Kashani K, Jentzer JC, et al. Doppler-defined pulmonary hypertension in sepsis and septic shock. J Crit Care. 2019;50:201-206. PMID: 30553991 DOI: 10.1016/j.jcrc.2018.12.008
- Hirao Y, Hu J, Matsuda B, Sato R. Relationship between echocardiography-estimated right ventricular-pulmonary artery coupling and mortality in septic shock. J Crit Care. 2025;88:155072. PMID: 40157318 DOI: 10.1016/j.jcrc.2025.155072