Tulika Mittal1, VK Badhe2, DS Divekar Badhe3, Pallavi Ahluwalia4, Balraj Mittal5, Rama Mittal6
Author affiliations:
Introduction & Objectives: Benzodiazepines are commonly used as adjuvants to IV anesthetic agents. Diazepam dosage varies widely depending on the desired endpoints. The rationale behind such inter-individual variability in drug responses has been attributed to genetically determined alterations in the enzyme activities. We assessed the emergence time in patients after induction of anesthesia with two different doses of diazepam and evaluated if any correlation exists between the emergence time and genetic polymorphism in drug metabolizers CYP2C19, CYP2C9, and CYP3A4 genes.
Methodology: The study was conducted on randomly selected adult patients scheduled for elective surgery between 40-60 y of age with predefined inclusion and exclusion criteria. The patients were distributed into 2 groups, with group 1 receiving 0.2 mg/kg and group 2 given 0.3 mg/kg diazepam. Wake-up time after surgery was determined after a standardized verbal command played by a tape-recorder. Three ml blood in Ethylenediaminetetraacetic acid (EDTA) was collected before administering anesthesia.
Results: Wake-up time between 8-18 min did not vary between the two groups. Comparatively persons having 2C19 2 took longer time to wake-up but this association was not statistically significant. However, CYP2C9 2 and 2 C9 3 and CYP3A4 genotypes had no influence on wake-up time.
Conclusion: The pilot study suggests the emergence time from diazepam is longer in patients having 2C19 2 which confers slow-metabolizer phenotype. However, this study needs to be replicated in larger sample size to arrive at definitive conclusions before clinical applications.
Abbreviations: BDZ- benzodiazepine; EDTA- Ethylenediaminetetraacetic acid; GA-General Anesthesia
Key words: Diazepam; Emergence; Gene Polymorphism; Pharmacogenetics
Citation: Mittal T, Badhe VK, Badhe DSD, Ahluwalia P, Mitta Bl, Mittal R. Effect on emergence from anesthesia following induction with diazepam and its association with CYP2C9, CYP2C19 and CYP3A4 gene polymorphisms. Anaesth. pain intensive care 2024;28(1):126-138. DOI: 10.35975/apic.v28i1.2380
Received: July 20, 2023; Reviewed: December 07, 2023; Accepted: December 07, 2023
Diazepam, a benzodiazepine (BDZ), is commonly used in the management of sleep disorders, anxiety, agitation and alcohol withdrawal. In 1966, McClish reported the use of diazepam as an induction agent in place of intravenous barbiturates.1
Following extensive clinical use, a detailed study demonstrated minimal cardiovascular depression following intravenous induction with diazepam, in patients who had prior cardiovascular disease.2 Subsequent studies suggested that diazepam would be a more suitable alternative for induction of general anesthesia (GA) in patients with cardiovascular disease.3
CYP is a complex and important component of drug metabolism, being the root of many drug interactions due to inhibition, induction, and competition for common enzymatic pathways by different drugs. Diazepam is mostly metabolized and very little is excreted unchanged. The drug undergoes oxidative metabolism and demethylation (by CYP 2C9, 2C19, 2B6, 3A4 and 3A5) hydroxylation (CYP 3A4 and 2C19) and glucuronidation in the liver as part of the cytochrome P450 enzyme system. Most BDZs are highly lipophilic and undergo extensive metabolism by CYP enzymes to increase elimination. There are wide inter-individual variations in the bio-transformations of BDZs, resulting in pronounced differences in plasma concentrations both after single dosing and multiple dosing and, possibly, in therapeutic and adverse effects, when the same dose is used.4
Many BDZs are metabolized to a significant extent by the polymorphic CYP2C19 and CYP3A4/5. Other CYPs, especially CYP1A2 and CYP2C9 may also be involved in the metabolism of some BDZs.5 Wide inter-individual variation in drug response has been attributed to genetic factors that influence the metabolism, transport or target sites of the drug. A scientific discipline termed ‘Pharmacogenetics’ has emerged to study the effect of genetic variations on drug dosage, efficacy and toxicities associated with the drugs.6 The drug dosage, between its therapeutic effect and apparent adverse reaction, defines the therapeutic window.
For many drugs, the optimum dose required for effective and safe therapy varies significantly from patient to patient. Presently most drugs are administered based on parameter like weight, which requires close monitoring and there is a risk of toxicity. However, pharmacogenetics can add another parameter of person’s ability to metabolize the drug.7 Basically, polymorphisms in the CYP gene family may have had the most impact on the fate of therapeutic drugs.8 Based on the polymorphisms, individuals are categorized as poor (PM), intermediate (IM) and fast metabolizers (FM). The drug dosage requirements for the same biological effect differ in different individuals, according to their genetic make-up. Therefore, when attempts are made to maximize drug efficacy and enhance drug safety, pharmacogenetics and pharmacogenomics can offer some novel contributions.
By testing a patient’s genetic profile, the clinician can make more informed decisions in finding the best medications and dosages for their patients.9
The study design is retrospective pharmacogenetic analysis of prospectively collected clinical data.
The study tested the hypothesis whether emergence of anesthesia with different doses of diazepam will be affected by the genetic variants of CYP2C19, CYP2C9, and CYP3A4.The study aimed to evaluate the influence of CYP gene polymorphisms on the clinical effect of diazepam as anesthesia induction agent, and to study whether there is any relationship between emergence time and two different dosages of diazepam based on genetic polymorphism detected in these patients.
After approval from hospital ethical committee, the study was conducted on 120 randomly selected, adult patients, ASA class 1or 2, between 40-60 y of age, scheduled for short elective surgeries (1-2 h) under GA, and after taking due consent for the procedure. Patients with history of hepatic, renal, metabolic or CNS disease, were excluded. Patients taking sedatives, those on proton pump inhibitors, H2 receptor blockers, antihypertensive drugs were also excluded. Patients were allocated and randomized by computer generated random number table into 2 groups A and B. Group A patients were induced with diazepam dosage of 0.2 mg/kg and Group B was induced with dosage of 0.3 mg/kg. For blinding purpose, primary anesthesiologist administered the drugs for induction of GA while other investigator (unaware of group allocation) was responsible for data collection. For the purpose of double blinding, patients were also kept unaware of group allocation. All patients were fasted for over 6 h and routine premedication was given. Paracetamol 15 mg/kg, a non-sedative analgesic was given 30 min before the procedure, as preemptive analgesic. In the operating room standard monitors were applied and baseline readings of heart rate (HR), systolic blood pressure (SBP), diastolic blood pressure (DBP) and mean blood pressure (MAP) were recorded. All patients were pre oxygenated for 3 min with oxygen flow rate of 6 L/min on circle breathing system. Patients were induced with inj. diazepam 0.2 mg/kg IV in Group A, while Group B received inj. diazepam 0.3 mg/kg. Propofol 1 mg/kg over 30 sec and succinylcholine 2mg/kg were injected IV. Patients were intubated 30 sec after the induction agent given. Maintenance of anesthesia was achieved with oxygen, nitrous oxide and Halothane 1.5% to 2%, with controlled respiration on circle breathing system. Muscle relaxation was maintained with inj. vecuronium at 0.08 mg/kg. Hemodynamic parameter including HR, SBP, DBP and MAP were measured at 5 min intervals throughout the procedure. The inspired and end tidal gases were measured using a gas analyzer.
After completion of the surgery, all inhaled anesthetics were discontinued and on return of spontaneous breaths the neuromuscular blockade was antagonized with neostigmine 0.05 mg/kg and glycopyrrolate 0.04 mg/kg and the patient was extubated and received oxygen via anesthetic circuit. The point where inhaled anesthetic was discontinued was taken as the anesthetic end point. The time from discontinuation of anesthetic agents till the patient awakened (emergence time) was measured.
Patients received a standardized verbal command to open their eyes and this command was played by tape every minute via headphones. Patients were considered to have awakened after they respond to verbal command. It was assessed by at least two observers (anesthesiologists, surgeon or nurse in charge of the case).
At the end of surgery, a recovery score was given to the patient based on the 3 parameters given in Annexure I. A patient receiving a score of 5 or 6 was considered to have been fully awakened. A 3 ml of peripheral blood was withdrawn from study group of patients before surgery in EDTA vial and mixed. It was transferred to freezer till the time of use for genotyping studies.
2.1. DNA extraction
DNA extraction was carried out by salting out method from peripheral blood leukocytes pellets.10
2.1.1. Genotyping of genetic markers
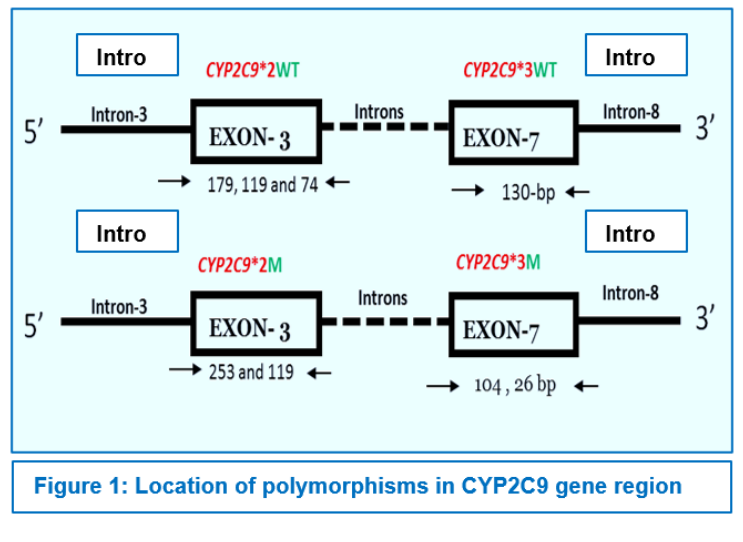
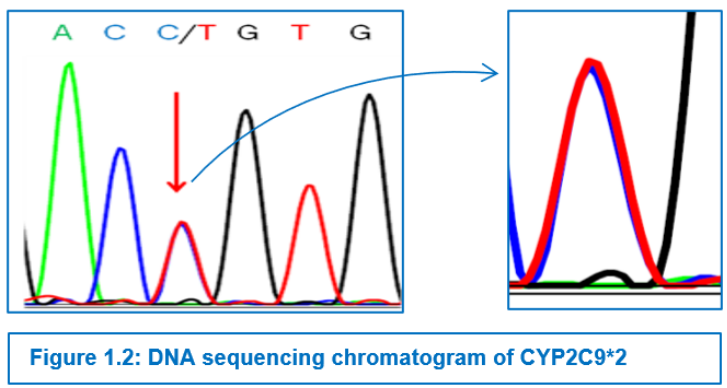
CYP2C9*2 (Exon 3, 430 C>T, rs1799853)
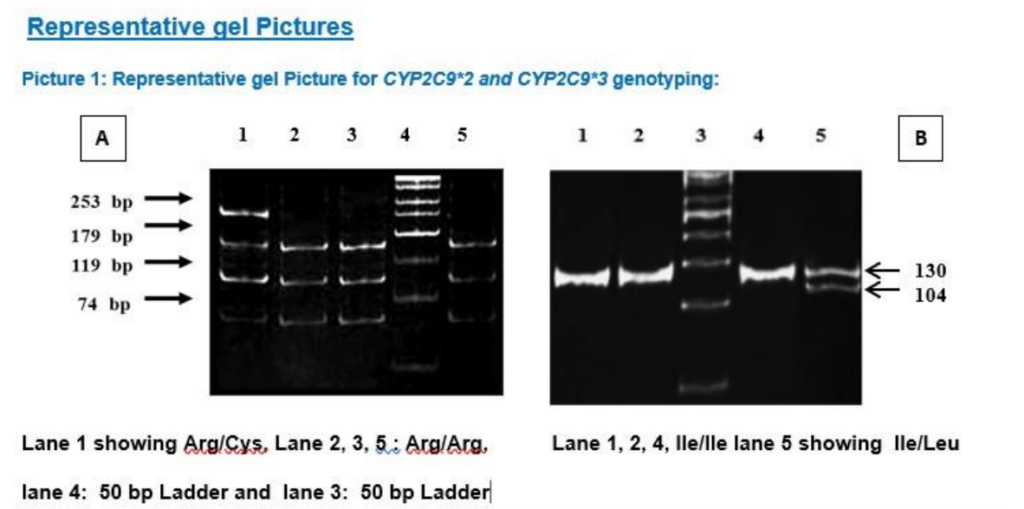
CYP2C9*2 was detected by PCR-RFLP as described,11 using primers (Table-1.2). 372-bp amplicon were amplified in a 25 µl PCR mix comprising of 10 mM Tris-HCl pH 8.3, 1.25 mM MgCl2, 50 mM KCl, 200 mM dNTPs, 0.2 mM of each of the primers, 2.5 U Taq polymerase, and 1 µl (50-100 ng) of genomic DNA. PCR was performed with an initial denaturation for 2 min at 94° C followed by 35 cycles of 30 s of denaturation at 94° C, 10 s of annealing at 60° C, 1 min of extension at 72° C, and a terminal extension for 7 min at 72° C (Table-1.1). Wild type alleles (Arg) cut into fragments of 179, 119 and 74 bp, whereas mutant alleles (Cys) showed fragments of 253 and 119 bp by loss of one restriction site. (Picture 1A).
CYP2C9*3 (Exon-7, 1075 A>C, rs1057910) was detected by a PCR-RFLP assay using primers as mentioned in Table 1.2
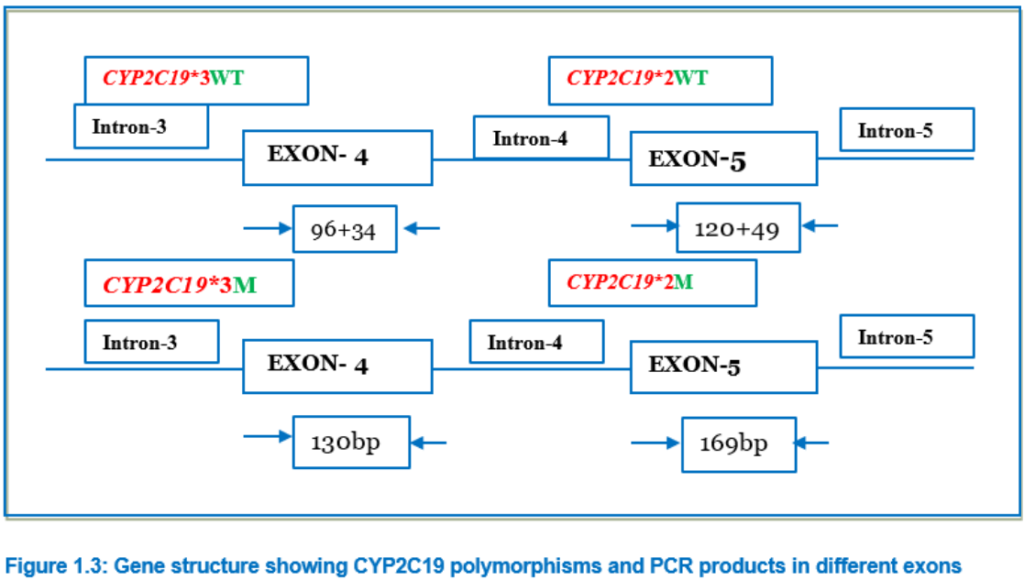
CYP2C19 *2 (Exon-5, 681G> A, rs2244285) and CYP2C19*3 (Exon-4, 636 G>A, rs4986893)
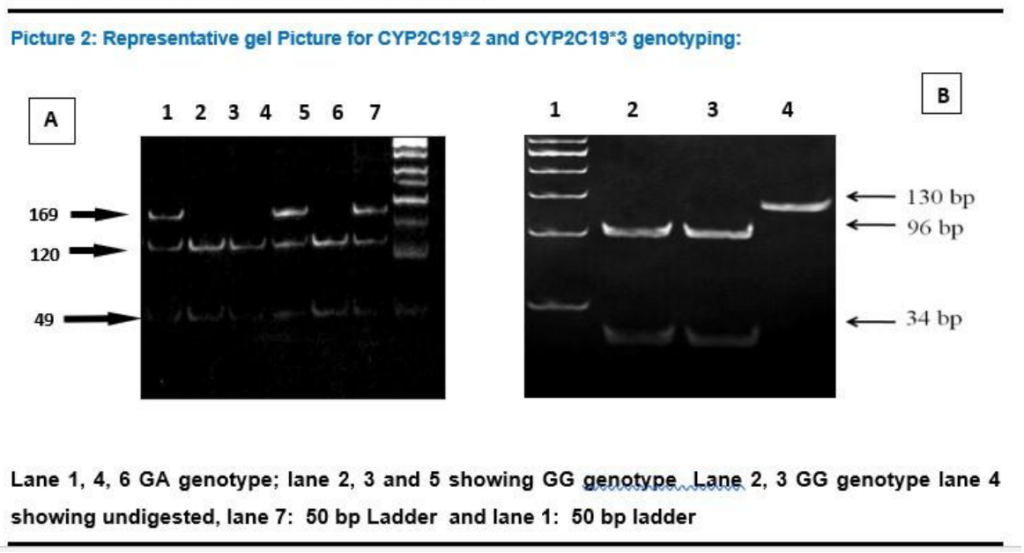
The wild type CYP2C19*1 gene and the two mutated genes, CYP2C19*2 and CYP2C19*3, were identified by PCR amplification using PCR- RFLP method.12 The primers used in this study were be m1F, m1R, m2F, and m2R (Table-1.2) and conditions are summarized in Table-1.3. After amplification, the amplicon was digested with restriction endonucleases in 10 μl of the buffer. For digestion of the 169-bp (for CYP2C19*2) or 130-bp (for CYP2C19*2) PCR product, 8 U of SmaI with NEB-3 buffer and 10U of BamHI, with buffer Tango® respectively, was used respectively and incubated at 37°C for overnight. The fragments digested by these enzymes were separated by 12% poly acrylamide gel electrophoresis, along with a DNA molecular weight marker. The wild types were assigned by the appearance of bands of 120 and 49 bp for CYP2C19*2, and of 96 and 34 bp for CYP2C19*3. (Picture 2A and Picture 2B)
CYP3A4*1B (Promoter, -290 G> A, rs2740574)
CYP3A4*1B is a promoter polymorphism which involves a nucleotide change of G>A at 290 position. It was also genotyped by a PCR-RFLP assay using primers (Table 1.2) and the PCR conditions are described in Table 1.3. 334bp amplicon was digested with 10 units of PstI (New England Biolabs); wild type allele is genotyped by three bands (220, 81 and 33 bp) and variant allele by four bands (199, 81, 33 and 21 bp).
The selected SNPs, their reference sequencing number (rs number), chromosome position, PCR product size and band pattern of RFLP are shown in Table 1.1.
Statistical analysis
Descriptive statistics of patients was presented as mean and standard deviations for continuous measures whereas frequencies and percentages were used for categorical measures. Allele and genotype frequencies were calculated by direct counting. Statistical significance of differences in genotype frequencies between patients with different treatment outcome was estimated by the Chi Square test. Binary logistic regression was used for all analysis variables to estimate risk as odds ratio (OR) with 95% confidence intervals (95%CIs). All statistical analyses were performed using the SPSS software version 17.0 (SPSS, Chicago, IL, USA). Tests of statistical significance were two-sided, and differences will be taken as significant when P < 0.05.
120 patients were selected for the study and divided into two groups (60 each). Group A patients, anesthesia was induced with diazepam at a dosage of 0.2 mg/kg and Group B patients anesthesia induced with diazepam at a dosage of 0.3 mg/kg. At the end of surgery all inhaled anesthetics were discontinued and patient received oxygen via anesthetic circuit. Emergence time of both groups, was recorded manually (Table 3 and Table 4). Depth of anesthesia in all cases of each group was monitored by BIS score (Table 2).
The range of BIS in these patients was between 40-60. In the rest of the patients, anesthetic depth was maintained by clinical parameters heart rate, blood pressure. No clinically significant adverse events, including deviations in blood pressure, pulse rate, and other physiological responses, were recognizable throughout the study phases. All subjects completed the study following the protocol. The CYP genotypes of Group A (Table 5) and Group B (Table 6) are done.
4.1. Patient characteristics
The demographic profile and the clinical characteristics of patients are shown in Table 7. These mean demographic data did not significantly differ between the two groups. Mean age (49.97 ± 6.84 vs. 50.15 ± 7.15), male/female ratio (48.3% vs. 51.7%) and mean weight (59.32 ± 9.83 vs. 60.37 ± 11.41) were not significantly different between the two groups of patients. Average emergence time 14 min and range 8-22 min. Further, both groups were also categorized on the basis of emergence time (Table 8) and we found that, about 34% of patients in both groups had emergence time between 14-16 min.
CYP Polymorphisms and its relation with emergence time
Influence of polymorphisms in drug metabolizing genes CYP2C9, CYP2C19 and CYP3A4 on diazepam induced anesthesia response to Emergence time was assessed in 120 patients. The strength of association was determined in terms of OR (95% CI) and P value, using SPSS and shown in Tables 2.6 to 2.8.
CYP2C9
In our study, none of the individuals were homozygous for the 2C9*2 (1075 A>C) or 2C9*3(430 C >T) (Table 9)
81.7% of patients of group A were homozygous for the 2C9*2 1075 AA genotype with 13.9 min mean wake-up time while 18.3% patients were heterozygous for 1075 AC genotype with 12.6 min mean wake-up time. Similarly, in group B, 80.0% patients were homozygous for the 2C9*2 1075 AA genotype with 14.7 min mean wake-up time and 20.0 % patients were heterozygous for 1075 AC genotype with 13.0 min mean wake-up time. No significant differences were observed at genotypic as well as allele level in both group of patients for 430 T variant (P = 0.335, P = 0.357 and P = 0.182, P = 0.206 respectively) (Table 9).
CYP2C9 430 C>T (*3 variant) polymorphism also did not showed any significant association with mean wake-up time in both group of patients either receiving 0.2 mg/kg of diazepam (Group A) and 0.3 mg/kg of diazepam (Group B) at both genotypic as well as allelic level (Table 10). Majority (93.3%) of patients of group A were homozygous for the 430CC genotype with 13.7 min mean wake-up time and only 6.7% patients were heterozygous for 430CT genotype with 12.7 min mean wake-up time. Similarly, in group B, 90.0% of the patients were homozygous for the 430CC genotype with 14.3 min mean wake-up time and 10.0 % patients were heterozygous for 430CT genotype with 14.7 min mean wake-up time. No significant differences were observed at genotypic as well as allele level in both group of patients for 430 T variant (P = 0.630, P = 0.632 and P = 0.825, P = 0.828 respectively) (Table 10 ).
CYP2C19*2 (681G>A) and CYP2C19*3 (636G>A):
Similar to CYP2C9, in group A, the mean wake-up time of patients with homozygous GG genotype of CYP2C19 681G>A was not significantly different with heterozygous and variant genotype patients mean wake-up time (13.5 min vs. 14.3 min, P = 0.507). But in group B patients, there was a significant difference between mean wake-up times of homozygous GG genotype and heterozygous genotype (13.3 min vs. 16.8 min, P = 0.001) (Table 11).
However, both groups did not show significant difference in mean wake-up times at their allelic levels. (Group A, allele G mean wake-up time 13.8 min vs. A allele mean wakeup time 13.4 min; P = 0.675 and (Group B, allele G mean wake-up time 14.3 min vs. A allele mean wakeup time 14.4 min; P = 0.949) (Table 11) The CYP2C19*3 636G>A polymorphism was found to be monomorphic in our population and hence the polymorphism does not contribute to drug response in our population.
CYP3A4*1B: Polymorphism
CYP3A4*1B polymorphism also did not show significant associations with mean wake-up time in patients having 0.2 mg/kg of diazepam (Group A) and 0.3 mg/kg of diazepam (Group B) at both genotypic as well as allelic level. (Table 12). 96.7% of patients of group A were homozygous for the CYP3A4*1B 290AA genotype with 13.7 min mean wake-up time and only 3.3% patients were heterozygous for 290AG genotype with 12.7 min mean wake-up time. In group B, there was no patient with heterozygous and variant genotype. All patients were homozygous for CYP3A4*1B 290AA genotype with 14.3 mean wakeup time. No significant differences were observed at genotypic as well as allele level in group A of patients for CYP3A4*1B 290 G variant (P = 0.903 in both cases) (Table 12).
Pharmacogenetics is the study of genetic differences in metabolic pathways which can affect individual responses to drugs, both in terms of therapeutic effect as well as adverse effects. Much of current clinical interest in pharmacogenetics, places great emphasis on improving drug safety. The wider use of pharmacogenetic testing is viewed by many as an outstanding opportunity to improve prescribing safety and efficacy. Driving this trend are the 106,000 deaths and 2.2 million serious events caused by adverse drug reactions in the US alone each year, where health-care is much advanced.1 As such ADRs are responsible for 5-7% of hospital admissions in the US and Europe, lead to the withdrawal of 4% of new medicines and cost society an amount equal to the costs of drug treatment.
The current perspectives in pharmacogenetics have led to the era of personalized medicines which relies on the presumption that every person has a unique variation of the human genome.13 Although most of the variation between individuals has no effect on health, an individual's health stems from genetic variation with behaviors and influences from the environment.13 Modern advances in personalized medicine rely on technology that confirms a patient's fundamental biology, DNA, RNA, or protein, which ultimately leads to confirming disease.
Here, genomic information is used to study individual responses to drugs. When a gene variant is associated with a particular drug response in a patient, there is the potential for making clinical decisions based on genetics by adjusting the dosage or choosing a different drug. Modern approaches include single nucleotide polymorphism (SNP) profiles, and these approaches are just coming into clinical use for drug discovery and development.14
The development of fundamental pharmacokinetics and pharmacodynamics concepts has enabled anesthesiologists to choose and dose anesthetic agents on a rational basis. The application of these concepts to a variety of clinical scenarios and patient populations makes it possible to individualize the dose, thereby decreasing the risk of complications. As more knowledge is gained about the sometimes profound differences in drug response, empirical dosing such as in milligrams per kilogram of total body weight will disappear from the anesthesia specialty.15
Anesthesia has been at the forefront in the discovery of pharmacogenomic disorders such as pseudocholinesterase deficiency, malignant hyperthermia (MH), and thiopental-induced porphyria, yet many anesthesia providers have limited knowledge of the topic beyond these specific disorders.16 Pharmacogenomics as a predictor of drug response is increasingly used in medicine and drug development. Taking into consideration the importance of pharmacogenetics in practice of anesthesia, we planned this study to assess the effect of genetic factors on the clinical effect of diazepam, a commonly used induction agent, particularly in cardiovascular surgeries. Paracetamol was given as non-sedative analgesic in start of the procedure. It was given as a preemptive analgesic. The main mechanism of paracetamol action is inhibition of COX-2 activity.17 They act primarily in peripheral tissues to inhibit the formation of pain-producing substances such as prostaglandins. They do not produce any sedation since they act peripherally and not centrally. So, the emergence time following diazepam induction is not affected by using paracetamol as preemptive analgesic. Paracetamol is metabolized primarily in the liver. Animal and human in vitro studies have shown that the CYP isoenzyme responsible for the majority of human biotransformation of paracetamol to NAPQI is CYP2E1.18 As diazepam is primarily metabolized by CYP2C19, paracetamol does not interfere with action of diazepam.
In our study, we assessed the time of emergence of patient after induction of anesthesia with two different doses of diazepam based on genetic polymorphism in CYP2C19, CYP2C9, CYP3A4 genes. We observed that the mean time of emergence was higher in patients with mutant alleles of CYP2C19*2 after induction of anesthesia with 0.3 mg/kg doses of diazepam. No association was found in both group of patients in CYP2C9*2 (430 C>T), CYP2C9*3 (1075 A>C), CYP3A4*1B. CYP2C19*3 turned out to be monomorphic in our population and therefore does not seem to be important among Indians.
These results were in agreement with previous studies in which the pharmacokinetic profiles of diazepam has been shown to depend on the activity of CYP2C19 enzyme.19, 20, 21 Andersson et al. showed that the N-demethylation of diazepam was catalysed by CYP2C19 and CYP3A4, whereas the 3-hydroxylation was catalyzed mainly by CYP3A4 in human liver microsomes.22 The results of the study by Jung et al. were virtually the same.23 Bertilsson et al. reported that PMs of CYP2C19 showed significantly lower clearance (12 vs. 26 mL/m) and longer elimination half-life (t1/2) (88 vs. 41 h) of diazepam than EMs after a single oral dose of diazepam.24 Also, PMs had lower clearance and longer elimination t1/2 of desmethyldiazepam. Qin et al. reported that the area under the plasma concentration–time curve (AUC) and elimination t1/2 of both diazepam and desmethyldiazepam increased significantly according to the increase in mutated CYP2C19 alleles, suggesting significant effects of the gene-dose of CYP2C19 on the metabolism of diazepam and desmethyldiazepam.19
Ghoneim et al. reported a lower clearance of diazepam among Orientals than among Caucasians, and this may be explained by the higher prevalence of the CYP2C19 deficiency in the former group.25
Our findings are in support to previous observations which identified CYP2C19 as major drug metabolizer for commonly prescribed benzodiazepines. On the basis of these observations, we propose that poor metabolizer phenotype of CYP2C19 could have advantage over extensive metabolizer phenotype in patients during induction of anesthesia; it is likely that patients with poor metabolizer phenotype will require lesser drug doses of diazepam as compared to patients with extensive metabolism. So, patients with extensive metabolism are more likely to become drug resistant during the induction of anesthesia.
However, we did not find any obvious difference in wake-up time based on CYP2C9 at allele or genotype levels. Also, the difference in two groups receiving 0.2 and 0.3 mg/kg were not obvious. It also conforms with earlier reports that CYP2C9 does not play important role in metabolism of diazepam. Similarly, CYP3A4 polymorphisms also did not influence the wake-up time of diazepam.
The results of present study show that CYP2C19 polymorphisms have visible and significant effect on anesthesia duration. However, the differences were not too spectacular to influence clinical practice. However, we did not observe rare 2C19*2 homozygous variants with 2 mutant alleles who may be slow metabolizers and result in prolonged effect of anesthesia. It would be advisable to use lower dose of the drug.
It is obvious that diazepam given 0.2 mg/kg is equally effective than 0.3 mg/kg. Also, the lower dose is not influenced by CYP2C19 polymorphism. Therefore, lower regimen is more suited for patients in our population.
It is case-only association study which draws its conclusions based on statistical analysis which ideally requires large number of samples. In this regard, sample size of 60 in each group will obviously result in low statistical power. Therefore, the study may be replicated in larger number of patients before clinical implementation.
Another limitation is that we have only considered three genes from drug metabolism pathway. However, drug response is also affected by drug transport and drug targets. Therefore, future studies should also consider exploring genes from those pathways. To overcome limitations in number of genes, the present study designs have considered using whole genome chips. However, such studies will be prohibitory expensive. A middle ground will to carry out multi-centric studies where each Centre carries out study in small group which can be meta-analyzed.
Mean wake-up time of diazepam induced general anesthesia was not significantly different between two doses (0.2 mg/kg or 0.3 mg/kg). Genetic polymorphisms in CYP2C9 polymorphism (*2 and *3) did not affect the wake-up time of diazepam-induced general anesthesia, in both low and high doses of the anesthetic agent. Genetic polymorphism in CYP2C19(CYP2C19 681G>A, CYP2C19*2) polymorphism at genotype level did not influence wake-up in in group receiving diazepam at 0.2 mg/kg but there was significant increase in wake-up time of patient with CYP2C19*2 receiving 0.3 mg/kg diazepam.CYP2C19*3 636G>A polymorphism was not observed in our group of patients. CYP3A4*1B polymorphism also did not significant associate with mean wake-up time in both group of patients. These findings support the fact that CYP2C19 is important gene for pharmacogenetic studies of diazepam. Higher dose of diazepam in 2C19*2 may also result in drug-associated adverse drug reactions. As diazepam at 0.2 mg/kg is not influenced by CYP2C19 polymorphism, therefore the lower dosage of diazepam may be preferred for anesthesia.
7. Data availability
The numerical data generated during this research is available with the authors.
8. Acknowledgement
We gratefully thank the help and assistance provided by our respective departments.
9. Conflict of interest
The study utilized the hospital resources only, and no external or industry funding was involved.
10. Authors’ contribution
TM: conduct of study, literature search, manuscript compilation
VKB: literature search, manuscript editing
DS D- Concept, literature search, manuscript editing
PA- Statistical Analysis and Manuscript editing
BM- Conduct of study, literature search, statistical analysis and manuscript editing
RM- Concept, literature search, Manuscript editing
Author affiliations:
- Tulika Mittal, Rohilkhand Medical College, Bareilly, Uttar Pradesh, India; E-mail: tulika1234@gmail.com
- VK Badhe, Pravara Institute of Medical Sciences, Loni Maharashtra, India; E-mail: vaijubadhe@gmail.com
- DS Divekar Badhe, Pravara Institute of Medical Sciences, Loni Maharashtra, India; E-mail: dasdivekar@yahoo.com
- Pallavi Ahluwalia, Teerthankar Mahaveer Medical College, Moradabad, India; E-mail: drpallaviahluwalia@yahoo.com
- Balraj Mittal, Sanjay Gandhi Institute of Medical Sciences, Lucknow, India; E-mail: balrajmittal@gmail.com
- Rama Mittal, Sanjay Gandhi Institute of Medical Sciences, Lucknow, India; E-mail: ramamittal@gmail.com
ABSTRACT
Introduction & Objectives: Benzodiazepines are commonly used as adjuvants to IV anesthetic agents. Diazepam dosage varies widely depending on the desired endpoints. The rationale behind such inter-individual variability in drug responses has been attributed to genetically determined alterations in the enzyme activities. We assessed the emergence time in patients after induction of anesthesia with two different doses of diazepam and evaluated if any correlation exists between the emergence time and genetic polymorphism in drug metabolizers CYP2C19, CYP2C9, and CYP3A4 genes.
Methodology: The study was conducted on randomly selected adult patients scheduled for elective surgery between 40-60 y of age with predefined inclusion and exclusion criteria. The patients were distributed into 2 groups, with group 1 receiving 0.2 mg/kg and group 2 given 0.3 mg/kg diazepam. Wake-up time after surgery was determined after a standardized verbal command played by a tape-recorder. Three ml blood in Ethylenediaminetetraacetic acid (EDTA) was collected before administering anesthesia.
Results: Wake-up time between 8-18 min did not vary between the two groups. Comparatively persons having 2C19 2 took longer time to wake-up but this association was not statistically significant. However, CYP2C9 2 and 2 C9 3 and CYP3A4 genotypes had no influence on wake-up time.
Conclusion: The pilot study suggests the emergence time from diazepam is longer in patients having 2C19 2 which confers slow-metabolizer phenotype. However, this study needs to be replicated in larger sample size to arrive at definitive conclusions before clinical applications.
Abbreviations: BDZ- benzodiazepine; EDTA- Ethylenediaminetetraacetic acid; GA-General Anesthesia
Key words: Diazepam; Emergence; Gene Polymorphism; Pharmacogenetics
Citation: Mittal T, Badhe VK, Badhe DSD, Ahluwalia P, Mitta Bl, Mittal R. Effect on emergence from anesthesia following induction with diazepam and its association with CYP2C9, CYP2C19 and CYP3A4 gene polymorphisms. Anaesth. pain intensive care 2024;28(1):126-138. DOI: 10.35975/apic.v28i1.2380
Received: July 20, 2023; Reviewed: December 07, 2023; Accepted: December 07, 2023
1. INTRODUCTION
Diazepam, a benzodiazepine (BDZ), is commonly used in the management of sleep disorders, anxiety, agitation and alcohol withdrawal. In 1966, McClish reported the use of diazepam as an induction agent in place of intravenous barbiturates.1
Following extensive clinical use, a detailed study demonstrated minimal cardiovascular depression following intravenous induction with diazepam, in patients who had prior cardiovascular disease.2 Subsequent studies suggested that diazepam would be a more suitable alternative for induction of general anesthesia (GA) in patients with cardiovascular disease.3
CYP is a complex and important component of drug metabolism, being the root of many drug interactions due to inhibition, induction, and competition for common enzymatic pathways by different drugs. Diazepam is mostly metabolized and very little is excreted unchanged. The drug undergoes oxidative metabolism and demethylation (by CYP 2C9, 2C19, 2B6, 3A4 and 3A5) hydroxylation (CYP 3A4 and 2C19) and glucuronidation in the liver as part of the cytochrome P450 enzyme system. Most BDZs are highly lipophilic and undergo extensive metabolism by CYP enzymes to increase elimination. There are wide inter-individual variations in the bio-transformations of BDZs, resulting in pronounced differences in plasma concentrations both after single dosing and multiple dosing and, possibly, in therapeutic and adverse effects, when the same dose is used.4
Many BDZs are metabolized to a significant extent by the polymorphic CYP2C19 and CYP3A4/5. Other CYPs, especially CYP1A2 and CYP2C9 may also be involved in the metabolism of some BDZs.5 Wide inter-individual variation in drug response has been attributed to genetic factors that influence the metabolism, transport or target sites of the drug. A scientific discipline termed ‘Pharmacogenetics’ has emerged to study the effect of genetic variations on drug dosage, efficacy and toxicities associated with the drugs.6 The drug dosage, between its therapeutic effect and apparent adverse reaction, defines the therapeutic window.
For many drugs, the optimum dose required for effective and safe therapy varies significantly from patient to patient. Presently most drugs are administered based on parameter like weight, which requires close monitoring and there is a risk of toxicity. However, pharmacogenetics can add another parameter of person’s ability to metabolize the drug.7 Basically, polymorphisms in the CYP gene family may have had the most impact on the fate of therapeutic drugs.8 Based on the polymorphisms, individuals are categorized as poor (PM), intermediate (IM) and fast metabolizers (FM). The drug dosage requirements for the same biological effect differ in different individuals, according to their genetic make-up. Therefore, when attempts are made to maximize drug efficacy and enhance drug safety, pharmacogenetics and pharmacogenomics can offer some novel contributions.
By testing a patient’s genetic profile, the clinician can make more informed decisions in finding the best medications and dosages for their patients.9
The study design is retrospective pharmacogenetic analysis of prospectively collected clinical data.
2. METHODOLOGY
The study tested the hypothesis whether emergence of anesthesia with different doses of diazepam will be affected by the genetic variants of CYP2C19, CYP2C9, and CYP3A4.The study aimed to evaluate the influence of CYP gene polymorphisms on the clinical effect of diazepam as anesthesia induction agent, and to study whether there is any relationship between emergence time and two different dosages of diazepam based on genetic polymorphism detected in these patients.
After approval from hospital ethical committee, the study was conducted on 120 randomly selected, adult patients, ASA class 1or 2, between 40-60 y of age, scheduled for short elective surgeries (1-2 h) under GA, and after taking due consent for the procedure. Patients with history of hepatic, renal, metabolic or CNS disease, were excluded. Patients taking sedatives, those on proton pump inhibitors, H2 receptor blockers, antihypertensive drugs were also excluded. Patients were allocated and randomized by computer generated random number table into 2 groups A and B. Group A patients were induced with diazepam dosage of 0.2 mg/kg and Group B was induced with dosage of 0.3 mg/kg. For blinding purpose, primary anesthesiologist administered the drugs for induction of GA while other investigator (unaware of group allocation) was responsible for data collection. For the purpose of double blinding, patients were also kept unaware of group allocation. All patients were fasted for over 6 h and routine premedication was given. Paracetamol 15 mg/kg, a non-sedative analgesic was given 30 min before the procedure, as preemptive analgesic. In the operating room standard monitors were applied and baseline readings of heart rate (HR), systolic blood pressure (SBP), diastolic blood pressure (DBP) and mean blood pressure (MAP) were recorded. All patients were pre oxygenated for 3 min with oxygen flow rate of 6 L/min on circle breathing system. Patients were induced with inj. diazepam 0.2 mg/kg IV in Group A, while Group B received inj. diazepam 0.3 mg/kg. Propofol 1 mg/kg over 30 sec and succinylcholine 2mg/kg were injected IV. Patients were intubated 30 sec after the induction agent given. Maintenance of anesthesia was achieved with oxygen, nitrous oxide and Halothane 1.5% to 2%, with controlled respiration on circle breathing system. Muscle relaxation was maintained with inj. vecuronium at 0.08 mg/kg. Hemodynamic parameter including HR, SBP, DBP and MAP were measured at 5 min intervals throughout the procedure. The inspired and end tidal gases were measured using a gas analyzer.
After completion of the surgery, all inhaled anesthetics were discontinued and on return of spontaneous breaths the neuromuscular blockade was antagonized with neostigmine 0.05 mg/kg and glycopyrrolate 0.04 mg/kg and the patient was extubated and received oxygen via anesthetic circuit. The point where inhaled anesthetic was discontinued was taken as the anesthetic end point. The time from discontinuation of anesthetic agents till the patient awakened (emergence time) was measured.
Patients received a standardized verbal command to open their eyes and this command was played by tape every minute via headphones. Patients were considered to have awakened after they respond to verbal command. It was assessed by at least two observers (anesthesiologists, surgeon or nurse in charge of the case).
At the end of surgery, a recovery score was given to the patient based on the 3 parameters given in Annexure I. A patient receiving a score of 5 or 6 was considered to have been fully awakened. A 3 ml of peripheral blood was withdrawn from study group of patients before surgery in EDTA vial and mixed. It was transferred to freezer till the time of use for genotyping studies.
2.1. DNA extraction
DNA extraction was carried out by salting out method from peripheral blood leukocytes pellets.10
2.1.1. Genotyping of genetic markers
CYP2C9*2 (Exon 3, 430 C>T, rs1799853)
CYP2C9*2 was detected by PCR-RFLP as described,11 using primers (Table-1.2). 372-bp amplicon were amplified in a 25 µl PCR mix comprising of 10 mM Tris-HCl pH 8.3, 1.25 mM MgCl2, 50 mM KCl, 200 mM dNTPs, 0.2 mM of each of the primers, 2.5 U Taq polymerase, and 1 µl (50-100 ng) of genomic DNA. PCR was performed with an initial denaturation for 2 min at 94° C followed by 35 cycles of 30 s of denaturation at 94° C, 10 s of annealing at 60° C, 1 min of extension at 72° C, and a terminal extension for 7 min at 72° C (Table-1.1). Wild type alleles (Arg) cut into fragments of 179, 119 and 74 bp, whereas mutant alleles (Cys) showed fragments of 253 and 119 bp by loss of one restriction site. (Picture 1A).
CYP2C9*3 (Exon-7, 1075 A>C, rs1057910) was detected by a PCR-RFLP assay using primers as mentioned in Table 1.2
| Table 1.1: Site of change and effect of genetic polymorphisms under study | |||||
| Genes
(Reference) |
dbSNP rs# | Variant/
mutant allele |
Site of polymorphism/ effect | Change-activity | Chromosomal
position |
| CYP2C9 | rs1799853 | C (*2) | 430C>T(Arg144Cys, Exon-3) | Decreased | 10q24 |
| CYP2C9 | rs1057910 | T (*3) | 1075 A>C(Ile359 Leu, Exon-7) | Decreased | 10q24 |
| CYP2C19 | rs2244285 | A (*2) | 681G>A (splicing defect, Exon-5) | None | 10q24.1-q24.3 |
| CYP2C19 | rs4986893 | A (*3) | 636 G>A (stop codon, Exon-4) | None | 10q24.1-q24.3 |
| Table 1.2: List of primers used | |||
| Primers | Nucleotide Sequence Sequences | RE/wild/variant product Size | References |
| CYP2C9*2F’ | 5’-CACTGGCTGAAAGAGCTAACAGAG-3’ | Sau96I/ 179, 119 and 74 bp 253 and 119 bp | 85 |
| CYP2C9*2R’ | 5’-GTGATATGGAGTAGGGTCACCCAC-3’ | ||
| CYP2C9*3F’ | 5’-AGGAAGAGATTGAACGTGTGA-3’ | StyI/130-bp 104 and 26 bp |
|
| CYP2C9*3R’ | 5’-GGCAGGCTGGTGGGGAGAAGGCCAA-3’ | ||
| CYP2C19*2 m1F’ | 5'-AATTACAACCAGAGCTTGGC-3’ | SmaI/169 120,49 |
86, 87 |
| CYP2C19*2m1R’ | 5'-TATCACTTTCCATAAAAGCAAG-3’ | ||
| CYP2C19*3 m2F’ | 5'-ATTGAATGAAAACATCAGGATTG-3’ | BamHI/96 and 34 130 bp |
|
| CYP2C19*3m2R’ | 5'-ACTTCAGGGCTTGGTCAATA-3’ | ||
| CYP3A4*1BF’ | 5’-GGACAGCCATAGAGACAACTGCA-3’ | PstI/220, 81 and 33 | 88 |
| CYP3A4*1BR’ | 5’-CTTTCCTGCCCTGCACAG-3’ | bp and 199, 81, 33 and 21 | |
| Table 1.3: Summary of PCR conditions for various markers | |||||
| Steps | CYP2C9*2 | CYP2C9*3 | CYP2C19*2 | CYP2C19*3 | CYP3A4*1B |
| Initial Denaturation | 94°C for 4 min | 94°C for 2 min | 94°C for 4 min | 94°C for 5 min | 94°C for 5 min |
| Denaturation | 94°C for 1 min | 94°C for 30 sec | 94°C for 1 min | 94°C for 1 min | 94°C for 30 sec |
| Annealing | 62°C for 45 sec | 57.5°C for 45 sec | 57°C for 30 sec | 56°C for 30 sec | 55°C for 20 sec |
| Extension | 72°C for 1 min | 72°C for 30 sec | 72°C for 30 sec | 72°C for 30 sec | 72°C for 30 sec |
| Final Extension | 72°C for 7 min | 72°C for 7 min | 72°C for 7 min | 72°C for 7 min | 72°C for 5 min |
CYP2C19 *2 (Exon-5, 681G> A, rs2244285) and CYP2C19*3 (Exon-4, 636 G>A, rs4986893)
The wild type CYP2C19*1 gene and the two mutated genes, CYP2C19*2 and CYP2C19*3, were identified by PCR amplification using PCR- RFLP method.12 The primers used in this study were be m1F, m1R, m2F, and m2R (Table-1.2) and conditions are summarized in Table-1.3. After amplification, the amplicon was digested with restriction endonucleases in 10 μl of the buffer. For digestion of the 169-bp (for CYP2C19*2) or 130-bp (for CYP2C19*2) PCR product, 8 U of SmaI with NEB-3 buffer and 10U of BamHI, with buffer Tango® respectively, was used respectively and incubated at 37°C for overnight. The fragments digested by these enzymes were separated by 12% poly acrylamide gel electrophoresis, along with a DNA molecular weight marker. The wild types were assigned by the appearance of bands of 120 and 49 bp for CYP2C19*2, and of 96 and 34 bp for CYP2C19*3. (Picture 2A and Picture 2B)
CYP3A4*1B (Promoter, -290 G> A, rs2740574)
CYP3A4*1B is a promoter polymorphism which involves a nucleotide change of G>A at 290 position. It was also genotyped by a PCR-RFLP assay using primers (Table 1.2) and the PCR conditions are described in Table 1.3. 334bp amplicon was digested with 10 units of PstI (New England Biolabs); wild type allele is genotyped by three bands (220, 81 and 33 bp) and variant allele by four bands (199, 81, 33 and 21 bp).
| Table 2: Assessment of BIS scores in patients | |||
| Diazepam 0.2 mg/kg | Diazepam 0.3 mg/kg | ||
| Patient | BIS score | Patient | BIS score |
| A1 | 56 | B1 | 48 |
| A2 | 50 | B2 | 56 |
| A3 | 48 | B3 | 52 |
| A4 | 44 | B4 | 58 |
| A5 | 58 | B5 | 44 |
| A6 | B6 | B6 | 54 |
The selected SNPs, their reference sequencing number (rs number), chromosome position, PCR product size and band pattern of RFLP are shown in Table 1.1.
Statistical analysis
Descriptive statistics of patients was presented as mean and standard deviations for continuous measures whereas frequencies and percentages were used for categorical measures. Allele and genotype frequencies were calculated by direct counting. Statistical significance of differences in genotype frequencies between patients with different treatment outcome was estimated by the Chi Square test. Binary logistic regression was used for all analysis variables to estimate risk as odds ratio (OR) with 95% confidence intervals (95%CIs). All statistical analyses were performed using the SPSS software version 17.0 (SPSS, Chicago, IL, USA). Tests of statistical significance were two-sided, and differences will be taken as significant when P < 0.05.
4. RESULTS
120 patients were selected for the study and divided into two groups (60 each). Group A patients, anesthesia was induced with diazepam at a dosage of 0.2 mg/kg and Group B patients anesthesia induced with diazepam at a dosage of 0.3 mg/kg. At the end of surgery all inhaled anesthetics were discontinued and patient received oxygen via anesthetic circuit. Emergence time of both groups, was recorded manually (Table 3 and Table 4). Depth of anesthesia in all cases of each group was monitored by BIS score (Table 2).
| Table 3: Patient details and emergent time after Diazepam dose of 0.2 mg/kg | |||||||||||
| Patient | Age/sex | Weight (kg) | Emergence time (min) | Patient | Age/sex | Weight (kg) | Emergence time (min) | Patient | Age/sex | Weight (kg) | Emergence time
(min) |
| A1 | 40/F | 54 | 12 | A21 | 48/M | 65 | 14 | A41 | 59/M | 70 | 16 |
| A2 | 46/F | 64 | 15 | A22 | 54/M | 56 | 12 | A42 | 43/F | 50 | 9 |
| A3 | 60/M | 70 | 14 | A23 | 44/F | 40 | 12 | A43 | 60/F | 65 | 12 |
| A4 | 55/M | 68 | 14 | A24 | 50/F | 60 | 14 | A44 | 48/M | 68 | 14 |
| A5 | 48/M | 60 | 10 | A25 | 54/M | 40 | 16 | A45 | 60/M | 60 | 18 |
| A6 | 48/F | 54 | 10 | A26 | 46/M | 68 | 12 | A46 | 55/F | 66 | 20 |
| A7 | 60/F | 44 | 12 | A27 | 40/F | 46 | 8 | A47 | 48/M | 76 | 22 |
| A8 | 45/F | 56 | 14 | A28 | 58/M | 60 | 9 | A48 | 54/M | 74 | 22 |
| A9 | 50/F | 50 | 16 | A29 | 40/F | 66 | 10 | A49 | 46/M | 56 | 08 |
| A10 | 52/M | 66 | 16 | A30 | 45/M | 70 | 18 | A50 | 48/f | 58 | 14 |
| A11 | 44/F | 56 | 18 | A31 | 45/M | 60 | 16 | A51 | 45/F | 60 | 16 |
| A12 | 58/M | 68 | 15 | A32 | 57/F | 78 | 12 | A52 | 45/F | 58 | 14 |
| A13 | 40/F | 64 | 10 | A33 | 66/M | 64 | 10 | A53 | 44/F | 74 | 20 |
| A14 | 55/M | 58 | 9 | A34 | 44/M | 44 | 09 | A54 | 56/M | 65 | 12 |
| A15 | 44/F | 42 | 15 | A35 | 54/F | 54 | 20 | A55 | 50/M | 64 | 14 |
| A16 | 56/M | 72 | 12 | A36 | 43/F | 56 | 22 | A56 | 56/M | 58 | 09 |
| A17 | 46/M | 64 | 14 | A37 | 48/F | 40 | 10 | A57 | 58/F | 44 | 08 |
| A18 | 44/F | 38 | 14 | A38 | 38/F | 64 | 14 | A58 | 40/F | 56 | 12 |
| A19 | 58/M | 64 | 8 | A39 | 40/M | 58 | 10 | A59 | 47/F | 70 | 18 |
| A20 | 60/F | 54 | 8 | A40 | 43/M | 46 | 18 | A60 | 60/M | 66 | 20 |
| Table 4 Patient details and emergent time after diazepam dose of 0.3 mg/kg | |||||||||||
| Patient | Age/sex | Weight (kg) | Emergence time (min) | Patient | Age/sex | Weight (kg) | Emergence time (min) | Patient | Age/sex | Weight (kg) | Emergence time (min) |
| B1 | 44/F | 44 | 16 | B21 | 60/M | 68 | 18 | B41 | 60/M | 78 | 22 |
| B2 | 56/M | 70 | 14 | B222 | 42/F | 52 | 12 | B42 | 42/M | 60 | 14 |
| B3 | 42/M | 64 | 12 | B23 | 55/M | 70 | 08 | B43 | 60/F | 50 | 10 |
| B4 | 60/F | 56 | 14 | B24 | 44/M | 68 | 12 | B44 | 46/F | 54 | 14 |
| B5 | 42/F | 40 | 14 | B25 | 60/F | 78 | 10 | B45 | 40/M | 60 | 16 |
| B6 | 58/M | 58 | 18 | B26 | 42/F | 54 | 15 | B46 | 50/F | 60 | 14 |
| B7 | 45/M | 58 | 18 | B27 | 45/M | 70 | 14 | B47 | 45/M | 64 | 16 |
| B8 | 40/M | 80 | 18 | B28 | 54/M | 60 | 18 | B48 | 40/F | 52 | 12 |
| B9 | 42/F | 76 | 22 | B29 | 58/F | 34 | 09 | B49 | 56/M | 76 | 18 |
| B10 | 54/F | 64 | 9 | B30 | 42/F | 44 | 17 | B50 | 60/M | 54 | 10 |
| B11 | 40/F | 42 | 12 | B31 | 48/M | 65 | 08 | B51 | 56/M | 66 | 20 |
| B12 | 43/M | 76 | 08 | B32 | 58/M | 58 | 11 | B52 | 42/F | 54 | 09 |
| B13 | 55/F | 64 | 16 | B33 | 60/F | 80 | 20 | B53 | 60/F | 50 | 10 |
| B14 | 60/M | 60 | 18 | B34 | 45/F | 56 | 14 | B54 | 60/M | 72 | 22 |
| B15 | 44/M | 64 | 20 | B35 | 43/M | 60 | 16 | B55 | 49/M | 66 | 16 |
| B16 | 45/F | 56 | 14 | B36 | 56/M | 78 | 12 | B56 | 50/F | 62 | 14 |
| B17 | 58/F | 44 | 10 | B37 | 51/F | 45 | 14 | B57 | 45/F | 50 | 11 |
| B18 | 46/M | 66 | 12 | B38 | 45/M | 68 | 11 | B58 | 55/F | 64 | 16 |
| B19 | 46/F | 36 | 09 | B39 | 46/F | 54 | 15 | B59 | 56/M | 68 | 18 |
| B20 | 60/M | 60 | 16 | B40 | 53/F | 44 | 12 | B60 | 50/M | 78 | 22 |
The range of BIS in these patients was between 40-60. In the rest of the patients, anesthetic depth was maintained by clinical parameters heart rate, blood pressure. No clinically significant adverse events, including deviations in blood pressure, pulse rate, and other physiological responses, were recognizable throughout the study phases. All subjects completed the study following the protocol. The CYP genotypes of Group A (Table 5) and Group B (Table 6) are done.
4.1. Patient characteristics
The demographic profile and the clinical characteristics of patients are shown in Table 7. These mean demographic data did not significantly differ between the two groups. Mean age (49.97 ± 6.84 vs. 50.15 ± 7.15), male/female ratio (48.3% vs. 51.7%) and mean weight (59.32 ± 9.83 vs. 60.37 ± 11.41) were not significantly different between the two groups of patients. Average emergence time 14 min and range 8-22 min. Further, both groups were also categorized on the basis of emergence time (Table 8) and we found that, about 34% of patients in both groups had emergence time between 14-16 min.
| Table 7: Patients characteristics | |||
| Parameter | Group A
(n = 60) |
Group B
(n = 60) |
P-values |
| *Age (y) | 49.97 ± 6.84 | 50.15 ± 7.15 | 0.886 |
| *Weight (kg) | 59.32 ± 9.83 | 60.37 ± 11.41 | 0.590 |
| Male sex | 29 (48.3%) | 31 (51.7%) | 0.855 |
CYP Polymorphisms and its relation with emergence time
Influence of polymorphisms in drug metabolizing genes CYP2C9, CYP2C19 and CYP3A4 on diazepam induced anesthesia response to Emergence time was assessed in 120 patients. The strength of association was determined in terms of OR (95% CI) and P value, using SPSS and shown in Tables 2.6 to 2.8.
| Table 5: CYP genotypes in Group A patients | |||||||||
| Patient ID | 2C9 430C > T | 2C9 1075A > C | 2C19 681G > A | 3A4*1A | Patient ID | 2C9 430C > T | 2C9 1075A > C | 2C19 681G > A | 3A4*1A |
| A1 | CC | AA | GG | AA | A31 | CC | AA | GG | AA |
| A2 | CC | AA | GG | AA | A32 | CC | AA | GA | AA |
| A3 | CC | AA | GA | AA | A33 | CC | AC | GG | AA |
| A4 | CC | AC | GG | AG | A34 | CC | AA | AA | AA |
| A5 | CC | AA | GG | AA | A35 | CC | AA | GA | AA |
| A6 | CC | AA | GG | AA | A36 | CT | AA | GG | AA |
| A7 | CC | AA | AA | AA | A37 | CC | AC | GA | AA |
| A8 | CC | AA | GG | AA | A38 | CC | AC | GG | AA |
| A9 | CC | AA | GG | AA | A39 | CC | AA | GA | AA |
| A10 | CC | AC | AA | AA | A40 | CC | AA | GG | AA |
| A11 | CC | AA | GG | AA | A41 | CC | AA | GA | AA |
| A12 | CC | AA | GG | AA | A42 | CC | AA | GG | AA |
| A13 | CC | AA | GG | AA | A43 | CC | AA | GG | AA |
| A14 | CT | AA | GG | AA | A44 | CC | AC | GA | AG |
| A15 | CC | AA | GG | AA | A45 | CC | AA | GG | AA |
| A16 | CC | AC | GG | AA | A46 | CC | AA | GG | AA |
| A17 | CC | AA | GA | AA | A47 | CC | AA | GA | AA |
| A18 | CC | AA | GG | AA | A48 | CC | AA | GG | AA |
| A19 | CC | AA | GG | AA | A49 | CC | AA | GA | AA |
| A20 | CC | AA | AA | AA | A50 | CC | AC | GG | AA |
| A21 | CC | AA | GG | AA | A51 | CC | AA | GA | AA |
| A22 | CC | AA | GG | AA | A52 | CC | AA | GG | AA |
| A23 | CC | AA | GA | AA | A53 | CC | AA | AA | AA |
| A24 | CC | AA | GA | AA | A54 | CT | AA | GG | AA |
| A25 | CC | AA | GA | AA | A55 | CC | AA | GA | AA |
| A26 | CC | AA | AA | AA | A56 | CC | AC | GG | AA |
| A27 | CT | AA | GG | AA | A57 | CC | AC | GA | AA |
| A28 | CC | AA | GA | AA | A58 | CC | AA | GG | AA |
| A29 | CC | AA | AA | AA | A59 | CC | AA | GA | AA |
| A30 | CC | AC | GG | AA | A60 | CC | AA | GG | AA |
CYP2C9
In our study, none of the individuals were homozygous for the 2C9*2 (1075 A>C) or 2C9*3(430 C >T) (Table 9)
81.7% of patients of group A were homozygous for the 2C9*2 1075 AA genotype with 13.9 min mean wake-up time while 18.3% patients were heterozygous for 1075 AC genotype with 12.6 min mean wake-up time. Similarly, in group B, 80.0% patients were homozygous for the 2C9*2 1075 AA genotype with 14.7 min mean wake-up time and 20.0 % patients were heterozygous for 1075 AC genotype with 13.0 min mean wake-up time. No significant differences were observed at genotypic as well as allele level in both group of patients for 430 T variant (P = 0.335, P = 0.357 and P = 0.182, P = 0.206 respectively) (Table 9).
CYP2C9 430 C>T (*3 variant) polymorphism also did not showed any significant association with mean wake-up time in both group of patients either receiving 0.2 mg/kg of diazepam (Group A) and 0.3 mg/kg of diazepam (Group B) at both genotypic as well as allelic level (Table 10). Majority (93.3%) of patients of group A were homozygous for the 430CC genotype with 13.7 min mean wake-up time and only 6.7% patients were heterozygous for 430CT genotype with 12.7 min mean wake-up time. Similarly, in group B, 90.0% of the patients were homozygous for the 430CC genotype with 14.3 min mean wake-up time and 10.0 % patients were heterozygous for 430CT genotype with 14.7 min mean wake-up time. No significant differences were observed at genotypic as well as allele level in both group of patients for 430 T variant (P = 0.630, P = 0.632 and P = 0.825, P = 0.828 respectively) (Table 10 ).
CYP2C19*2 (681G>A) and CYP2C19*3 (636G>A):
Similar to CYP2C9, in group A, the mean wake-up time of patients with homozygous GG genotype of CYP2C19 681G>A was not significantly different with heterozygous and variant genotype patients mean wake-up time (13.5 min vs. 14.3 min, P = 0.507). But in group B patients, there was a significant difference between mean wake-up times of homozygous GG genotype and heterozygous genotype (13.3 min vs. 16.8 min, P = 0.001) (Table 11).
| Table 6: CYP genotypes in Group B patients | ||||||||||
| Patient ID | 2C9 430C>T | 2C9 1075A>C | 2C19 681G>A | 3A4*1A | Patient ID | 2C9 430C>T | 2C9 1075A>C | 2C19 681G>A | 3A4*1A | |
| B1 | CC | AA | AA | AA | B31 | CC | AA | GA | AA | |
| B2 | CC | AA | GG | AA | B32 | CC | AA | AA | AA | |
| B3 | CC | AA | GG | AA | B33 | CC | AC | GA | AA | |
| B4 | CC | AA | GA | AA | B34 | CC | AA | GA | AA | |
| B5 | CC | AA | GG | AA | B35 | CC | AA | GG | AA | |
| B6 | CC | AA | AA | AA | B36 | CT | AA | GA | AA | |
| B7 | CT | AA | GA | AA | B37 | CC | AC | GA | AA | |
| B8 | CC | AA | GG | AA | B38 | CC | AC | AA | AA | |
| B9 | CC | AA | GA | AA | B39 | CC | AA | GG | AA | |
| B10 | CC | AC | GG | AA | B40 | CC | AA | GA | AA | |
| B11 | CC | AA | GG | AA | B41 | CC | AA | GA | AA | |
| B12 | CC | AA | GG | AA | B42 | CC | AA | GA | AA | |
| B13 | CC | AC | GG | AA | B43 | CC | AA | AA | AA | |
| B14 | CC | AA | AA | AA | B44 | CC | AA | GA | AA | |
| B15 | CC | AA | GG | AA | B45 | CC | AA | GG | AA | |
| B16 | CT | AA | GG | AA | B46 | CC | AA | AA | AA | |
| B17 | CC | AC | GA | AA | B47 | CT | AA | GG | AA | |
| B18 | CC | AC | GG | AA | B48 | CC | AA | GA | AA | |
| B19 | CC | AA | GA | AA | B49 | CC | AA | AA | AA | |
| B20 | CC | AA | GA | AA | B50 | CC | AC | GA | AA | |
| B21 | CC | AA | GA | AA | B51 | CC | AA | GG | AA | |
| B22 | CC | AA | AA | AA | B52 | CC | AA | AA | AA | |
| B23 | CC | AA | GA | AA | B53 | CC | AC | GG | AA | |
| B24 | CC | AA | AA | AA | B54 | CC | AA | GA | AA | |
| B25 | CC | AA | GG | AA | B55 | CC | AA | AA | AA | |
| B26 | CC | AA | GA | AA | B56 | CT | AA | GA | AA | |
| B27 | CT | AA | GA | AA | B57 | CC | AC | GG | AA | |
| B28 | CC | AA | AA | AA | B58 | CC | AC | AA | AA | |
| B29 | CC | AA | GA | AA | B59 | CC | AA | GG | AA | |
| B30 | CC | AC | GG | AA | B60 | CC | AA | GA | AA | |
However, both groups did not show significant difference in mean wake-up times at their allelic levels. (Group A, allele G mean wake-up time 13.8 min vs. A allele mean wakeup time 13.4 min; P = 0.675 and (Group B, allele G mean wake-up time 14.3 min vs. A allele mean wakeup time 14.4 min; P = 0.949) (Table 11) The CYP2C19*3 636G>A polymorphism was found to be monomorphic in our population and hence the polymorphism does not contribute to drug response in our population.
CYP3A4*1B: Polymorphism
CYP3A4*1B polymorphism also did not show significant associations with mean wake-up time in patients having 0.2 mg/kg of diazepam (Group A) and 0.3 mg/kg of diazepam (Group B) at both genotypic as well as allelic level. (Table 12). 96.7% of patients of group A were homozygous for the CYP3A4*1B 290AA genotype with 13.7 min mean wake-up time and only 3.3% patients were heterozygous for 290AG genotype with 12.7 min mean wake-up time. In group B, there was no patient with heterozygous and variant genotype. All patients were homozygous for CYP3A4*1B 290AA genotype with 14.3 mean wakeup time. No significant differences were observed at genotypic as well as allele level in group A of patients for CYP3A4*1B 290 G variant (P = 0.903 in both cases) (Table 12).
4. DISCUSSION
Pharmacogenetics is the study of genetic differences in metabolic pathways which can affect individual responses to drugs, both in terms of therapeutic effect as well as adverse effects. Much of current clinical interest in pharmacogenetics, places great emphasis on improving drug safety. The wider use of pharmacogenetic testing is viewed by many as an outstanding opportunity to improve prescribing safety and efficacy. Driving this trend are the 106,000 deaths and 2.2 million serious events caused by adverse drug reactions in the US alone each year, where health-care is much advanced.1 As such ADRs are responsible for 5-7% of hospital admissions in the US and Europe, lead to the withdrawal of 4% of new medicines and cost society an amount equal to the costs of drug treatment.
| Table 8 Emergence time of patients | ||||||
| Wake-up time | 8-10 min | 11-13 min | 14-16 min | 18-20 min | 20-22 min | Total |
| Male | 10 (16.7) | 12 (20.0) | 17 (28.3) | 11 (18.3) | 10 (16.7) | 60 |
| Female | 19 (31.7) | 9 (15.0) | 25 (41.7) | 3 (5.0) | 4 (6.0) | 60 |
| Diazepam 0.2 mg/kg (Group A) | 17 (28.3) | 10 (16.7) | 21 (35.0) | 5 (8.3) | 7 (11.7) | 60 |
| Diazepam 0.3 mg/kg (Group B) | 12 (20.0) | 11 (18.3) | 21(35.0) | 9 (15.0) | 7 (11.7) | 60 |
| Difference between Diazepam at 0.2 mg/kg (Group A) and 0.3 mg/kg (Group B) is not significant (P value 0.726) | ||||||
| Table 9 : CYP2C9*2 Polymorphism and its relation with emergence time | ||||||
| CYP2C9*2 | Group A | Group B | ||||
| Genotype | N (%) | Mean Wake-up time (min) | P value | N (%) | Wake-up time (Min) | P value |
| 1075 AA | 49 (81.7%) | 13.9 | Reference | 48 (80%) | 14.7 | Reference |
| 1075 AC+ CC | 11 (18.3%) | 12.6 | 0.335 | 12(20%) | 13.0 | 0.182 |
| Allele | ||||||
| 2C9 1075A (Wild) | 109 (90.8%) | 13.8 | Reference | 108 (90%) | 14.5 | Reference |
| 2C9 1075C (Mutant) | 11 (9.2%) | 12.6 | 0.357 | 12(10%) | 13.0 | 0.206 |
| Table 10: CYP2C9*3 Polymorphism and its relation with emergence time | ||||||
| CYP2C9*3 | Group A | Group B | ||||
| Genotype | N (%) | Mean Wake-up time (min) | P value | N (%) | Wake-up time (Min) | P value |
| 430 CC | 56(93.3%) | 13.7 | Reference | 54(90.0%) | 14.3 | Reference |
| 430 CT+TT | 4(6.7%) | 12.7 | 0.630 | 6(10.0%) | 14.7 | 0.825 |
| Allele | ||||||
| 2C9 430C (Wild) | 116(96.7%) | 13.7 | Reference | 114(95.0%) | 14.3 | Reference |
| 2C9 430T (Mutant) | 4(3.3%) | 12.8 | 0.632 | 6(5.0%) | 14.7 | 0.828 |
| Table 11: CYP2C19*2 Polymorphism and its relation with emergence time | ||||||
| CYP2C19*2 | Group A | Group B | ||||
| Genotypes | N (%) | Mean wake-up
time (min) |
P value | N (%) | Mean wake-up
time (min) |
P value |
| 681 GG | 47(78.3%) | 13.5 | Reference | 42(70.0%) | 13.3 | Reference |
| 681 GA+AA | 13(21.7%) | 14.3 | 0.507 | 18(30.0%) | 16.8 | 0.001 |
| Alleles | ||||||
| 2C19 681G (Wild) | 87(72.5%) | 13.8 | Reference | 67(55.8%) | 14.3 | Reference |
| 2C9 1 681A (Mutant) | 33(27.5%) | 13.4 | 0.675 | 53(44.2%) | 14.4 | 0.949 |
| Significant values are given in bold | ||||||
| Table 12: CYP3A4*1B Polymorphism and its relation with emergence time | ||||||
| CYP3A4*1B | Group A | Group B | ||||
| Genotypes | N (%) | Mean wake-up
time (min) |
P value | N (%) | Mean wake-up
time (min) |
P value |
| 290 AA | 58(96.7%) | 13.7 | Reference | 60(100%) | 14.3 | Reference |
| 290 AG +GG | 2(3.3%) | 14.0 | 0.903 | 0(0%) | - | - |
| Alleles | ||||||
| 3A4*1A (Wild) | 118(98.3%) | 13.7 | Reference | 120(100%) | 14.3 | Reference |
| 3A4*1B (Mutant) | 2(1.7%) | 14.0 | 0.903 | 0(0%) | - | - |
The current perspectives in pharmacogenetics have led to the era of personalized medicines which relies on the presumption that every person has a unique variation of the human genome.13 Although most of the variation between individuals has no effect on health, an individual's health stems from genetic variation with behaviors and influences from the environment.13 Modern advances in personalized medicine rely on technology that confirms a patient's fundamental biology, DNA, RNA, or protein, which ultimately leads to confirming disease.
Here, genomic information is used to study individual responses to drugs. When a gene variant is associated with a particular drug response in a patient, there is the potential for making clinical decisions based on genetics by adjusting the dosage or choosing a different drug. Modern approaches include single nucleotide polymorphism (SNP) profiles, and these approaches are just coming into clinical use for drug discovery and development.14
The development of fundamental pharmacokinetics and pharmacodynamics concepts has enabled anesthesiologists to choose and dose anesthetic agents on a rational basis. The application of these concepts to a variety of clinical scenarios and patient populations makes it possible to individualize the dose, thereby decreasing the risk of complications. As more knowledge is gained about the sometimes profound differences in drug response, empirical dosing such as in milligrams per kilogram of total body weight will disappear from the anesthesia specialty.15
Anesthesia has been at the forefront in the discovery of pharmacogenomic disorders such as pseudocholinesterase deficiency, malignant hyperthermia (MH), and thiopental-induced porphyria, yet many anesthesia providers have limited knowledge of the topic beyond these specific disorders.16 Pharmacogenomics as a predictor of drug response is increasingly used in medicine and drug development. Taking into consideration the importance of pharmacogenetics in practice of anesthesia, we planned this study to assess the effect of genetic factors on the clinical effect of diazepam, a commonly used induction agent, particularly in cardiovascular surgeries. Paracetamol was given as non-sedative analgesic in start of the procedure. It was given as a preemptive analgesic. The main mechanism of paracetamol action is inhibition of COX-2 activity.17 They act primarily in peripheral tissues to inhibit the formation of pain-producing substances such as prostaglandins. They do not produce any sedation since they act peripherally and not centrally. So, the emergence time following diazepam induction is not affected by using paracetamol as preemptive analgesic. Paracetamol is metabolized primarily in the liver. Animal and human in vitro studies have shown that the CYP isoenzyme responsible for the majority of human biotransformation of paracetamol to NAPQI is CYP2E1.18 As diazepam is primarily metabolized by CYP2C19, paracetamol does not interfere with action of diazepam.
In our study, we assessed the time of emergence of patient after induction of anesthesia with two different doses of diazepam based on genetic polymorphism in CYP2C19, CYP2C9, CYP3A4 genes. We observed that the mean time of emergence was higher in patients with mutant alleles of CYP2C19*2 after induction of anesthesia with 0.3 mg/kg doses of diazepam. No association was found in both group of patients in CYP2C9*2 (430 C>T), CYP2C9*3 (1075 A>C), CYP3A4*1B. CYP2C19*3 turned out to be monomorphic in our population and therefore does not seem to be important among Indians.
These results were in agreement with previous studies in which the pharmacokinetic profiles of diazepam has been shown to depend on the activity of CYP2C19 enzyme.19, 20, 21 Andersson et al. showed that the N-demethylation of diazepam was catalysed by CYP2C19 and CYP3A4, whereas the 3-hydroxylation was catalyzed mainly by CYP3A4 in human liver microsomes.22 The results of the study by Jung et al. were virtually the same.23 Bertilsson et al. reported that PMs of CYP2C19 showed significantly lower clearance (12 vs. 26 mL/m) and longer elimination half-life (t1/2) (88 vs. 41 h) of diazepam than EMs after a single oral dose of diazepam.24 Also, PMs had lower clearance and longer elimination t1/2 of desmethyldiazepam. Qin et al. reported that the area under the plasma concentration–time curve (AUC) and elimination t1/2 of both diazepam and desmethyldiazepam increased significantly according to the increase in mutated CYP2C19 alleles, suggesting significant effects of the gene-dose of CYP2C19 on the metabolism of diazepam and desmethyldiazepam.19
Ghoneim et al. reported a lower clearance of diazepam among Orientals than among Caucasians, and this may be explained by the higher prevalence of the CYP2C19 deficiency in the former group.25
Our findings are in support to previous observations which identified CYP2C19 as major drug metabolizer for commonly prescribed benzodiazepines. On the basis of these observations, we propose that poor metabolizer phenotype of CYP2C19 could have advantage over extensive metabolizer phenotype in patients during induction of anesthesia; it is likely that patients with poor metabolizer phenotype will require lesser drug doses of diazepam as compared to patients with extensive metabolism. So, patients with extensive metabolism are more likely to become drug resistant during the induction of anesthesia.
However, we did not find any obvious difference in wake-up time based on CYP2C9 at allele or genotype levels. Also, the difference in two groups receiving 0.2 and 0.3 mg/kg were not obvious. It also conforms with earlier reports that CYP2C9 does not play important role in metabolism of diazepam. Similarly, CYP3A4 polymorphisms also did not influence the wake-up time of diazepam.
The results of present study show that CYP2C19 polymorphisms have visible and significant effect on anesthesia duration. However, the differences were not too spectacular to influence clinical practice. However, we did not observe rare 2C19*2 homozygous variants with 2 mutant alleles who may be slow metabolizers and result in prolonged effect of anesthesia. It would be advisable to use lower dose of the drug.
It is obvious that diazepam given 0.2 mg/kg is equally effective than 0.3 mg/kg. Also, the lower dose is not influenced by CYP2C19 polymorphism. Therefore, lower regimen is more suited for patients in our population.
5. LIMITATIONS
It is case-only association study which draws its conclusions based on statistical analysis which ideally requires large number of samples. In this regard, sample size of 60 in each group will obviously result in low statistical power. Therefore, the study may be replicated in larger number of patients before clinical implementation.
Another limitation is that we have only considered three genes from drug metabolism pathway. However, drug response is also affected by drug transport and drug targets. Therefore, future studies should also consider exploring genes from those pathways. To overcome limitations in number of genes, the present study designs have considered using whole genome chips. However, such studies will be prohibitory expensive. A middle ground will to carry out multi-centric studies where each Centre carries out study in small group which can be meta-analyzed.
6. CONCLUSION
Mean wake-up time of diazepam induced general anesthesia was not significantly different between two doses (0.2 mg/kg or 0.3 mg/kg). Genetic polymorphisms in CYP2C9 polymorphism (*2 and *3) did not affect the wake-up time of diazepam-induced general anesthesia, in both low and high doses of the anesthetic agent. Genetic polymorphism in CYP2C19(CYP2C19 681G>A, CYP2C19*2) polymorphism at genotype level did not influence wake-up in in group receiving diazepam at 0.2 mg/kg but there was significant increase in wake-up time of patient with CYP2C19*2 receiving 0.3 mg/kg diazepam.CYP2C19*3 636G>A polymorphism was not observed in our group of patients. CYP3A4*1B polymorphism also did not significant associate with mean wake-up time in both group of patients. These findings support the fact that CYP2C19 is important gene for pharmacogenetic studies of diazepam. Higher dose of diazepam in 2C19*2 may also result in drug-associated adverse drug reactions. As diazepam at 0.2 mg/kg is not influenced by CYP2C19 polymorphism, therefore the lower dosage of diazepam may be preferred for anesthesia.
7. Data availability
The numerical data generated during this research is available with the authors.
8. Acknowledgement
We gratefully thank the help and assistance provided by our respective departments.
9. Conflict of interest
The study utilized the hospital resources only, and no external or industry funding was involved.
10. Authors’ contribution
TM: conduct of study, literature search, manuscript compilation
VKB: literature search, manuscript editing
DS D- Concept, literature search, manuscript editing
PA- Statistical Analysis and Manuscript editing
BM- Conduct of study, literature search, statistical analysis and manuscript editing
RM- Concept, literature search, Manuscript editing
11. REFERENCES
- McClish A. Diazepam as an intravenous induction agent for general anaesthesia. Can Anaesth Soc J. 1966;13(6):562-75. [PubMed] DOI: 1007/BF03002226
- Dalen JE, Evans GL, Banas JS Jr, Brooks HL, Paraskos JA, Dexter L. The hemodynamic and respiratory effects of diazepam (Valium). Anesthesiology. 1969;30(3):259-63. [PubMed] DOI: 1097/00000542-196903000-00002
- Rubin A, Allen GD, Everett GB. Induction of general anesthesia with diazepam or thiopental: a comparison of the cardiorespiratory effects. Anesth Prog. 1978;25(2):39-44. [PubMed]
- Fraser AD. Use and abuse of the benzodiazepines. Ther Drug Monit. 1998;20(5):481-9. [PubMed] DOI: 1097/00007691-199810000-00007
- Yasumori T, Nagata K, Yang SK, Chen LS, Murayama N, Yamazoe Y, et al. Cytochrome P450 mediated metabolism of diazepam in human and rat: involvement of human CYP2C in N-demethylation in the substrate concentration-dependent manner. Pharmacogenetics. 1993;3(6):291-301. [PubMed] DOI: 1097/00008571-199312000-00003
- Tutton R. Personalizing medicine: futures present and past. Soc Sci Med. 2012;75(10):1721-8. [PubMed] DOI: 1016/j.socscimed.2012.07.031
- Ingelman-Sundberg M, Rodriguez-Antona C. Pharmacogenetics of drug-metabolizing enzymes: implications for a safer and more effective drug therapy. Philos Trans R Soc Lond B Biol Sci. 2005;360(1460):1563-70. [PubMed] DOI: 1098/rstb.2005.1685
- Crettol S, Petrovic N, Murray M. Pharmacogenetics of phase I and phase II drug metabolism. Curr Pharm Des. 2010;16(2):204-19. [PubMed] DOI: 2174/138161210790112674
- Corrigan OP. Pharmacogenetics, ethical issues: review of the Nuffield Council on Bioethics Report. J Med Ethics. 2005;31(3):144-8. [PubMed] DOI: 1136/jme.2004.007229
- Miller SA, Dykes DD, Polesky HF. A simple salting out procedure for extracting DNA from human nucleated cells. Nucleic Acids Res. 1988;16(3):1215. [PubMed] DOI: 1093/nar/16.3.1215
- Aynacioglu AS, Brockmöller J, Bauer S, Sachse C, Güzelbey P, Ongen Z, et al. Frequency of cytochrome P450 CYP2C9 variants in a Turkish population and functional relevance for phenytoin. Br J Clin Pharmacol. 1999;48(3):409-15. [PubMed] DOI: 1046/j.1365-2125.1999.00012.x
- Sviri S, Shpizen S, Leitersdorf E, Levy M, Caraco Y. Phenotypic-genotypic analysis of CYP2C19 in the Jewish Israeli population. Clin Pharmacol Ther. 1999;65(3):275-82. [PubMed] DOI: 1016/S0009-9236(99)70106-2
- Karczewski KJ. Progress in genomics according to bingo: 2013 edition. Genome Biol. 2013;14(12):143. [PubMed] DOI: 1186/gb4148
- Adam J. Pharmacogenomics and Personalized Medicine. Nature Edu. 2008;1:194. [FreeFullText]
- Lemmens HJ, Stanski DR. Individualized dosing with anesthetic agents. Clin Pharmacol Ther. 2012;92(4):417-9. [PubMed] DOI: 1038/clpt.2012.131
- Galley HF, Mahdy A, Lowes DA. Pharmacogenetics and anesthesiologists. Pharmacogenomics. 2005;6(8):849-56. [PubMed] DOI: 2217/14622416.6.8.849
- Hinz B, Cheremina O, Brune K. Acetaminophen (paracetamol) is a selective cyclooxygenase-2 inhibitor in man. FASEB J. 2008;22(2):383-90. [PubMed] DOI: 1096/fj.07-8506com
- Kalsi SS, Wood DM, Waring WS, Dargan PI. Does cytochrome P450 liver isoenzyme induction increase the risk of liver toxicity after paracetamol overdose? Open Access Emerg Med. 2011;3:69-76. [PubMed] DOI: 2147/OAEM.S24962
- Qin XP, Xie HG, Wang W, He N, Huang SL, Xu ZH, et al. Effect of the gene dosage of CgammaP2C19 on diazepam metabolism in Chinese subjects. Clin Pharmacol Ther. 1999;66(6):642-6. [PubMed] DOI: 1016/S0009-9236(99)90075-9
- Yoshimoto K, Echizen H, Chiba K, Tani M, Ishizaki T. Identification of human CYP isoforms involved in the metabolism of propranolol enantiomers--N-desisopropylation is mediated mainly by CYP1A2. Br J Clin Pharmacol. 1995;39(4):421-31. [PubMed] DOI: 1111/j.1365-2125.1995.tb04472.x
- Sanz EJ, Villén T, Alm C, Bertilsson L. S-mephenytoin hydroxylation phenotypes in a Swedish population determined after coadministration with debrisoquin. Clin Pharmacol Ther. 1989;45(5):495-9. [PubMed] DOI: 1038/clpt.1989.63
- Andersson T, Miners JO, Veronese ME, Birkett DJ. Diazepam metabolism by human liver microsomes is mediated by both S-mephenytoin hydroxylase and CYP3A isoforms. Br J Clin Pharmacol. 1994;38(2):131-7. [PubMed] DOI: 1111/j.1365-2125.1994.tb04336.x
- Jung F, Richardson TH, Raucy JL, Johnson EF. Diazepam metabolism by cDNA-expressed human 2C P450s: identification of P4502C18 and P4502C19 as low K(M) diazepam N-demethylases. Drug Metab Dispos. 1997;25(2):133-9. [PubMed]
- Bertilsson L, Henthorn TK, Sanz E, Tybring G, Säwe J, Villén T. Importance of genetic factors in the regulation of diazepam metabolism: relationship to S-mephenytoin, but not debrisoquin, hydroxylation phenotype. Clin Pharmacol Ther. 1989;45(4):348-55. [PubMed] DOI: 1038/clpt.1989.40
- Ghoneim MM, Korttila K, Chiang CK, Jacobs L, Schoenwald RD, Mewaldt SP, Kayaba KO. Diazepam effects and kinetics in Caucasians and Orientals. Clin Pharmacol Ther. 1981;29(6):749-56. [PubMed] DOI: 1038/clpt.1981.106