
Joana Barroso Moreira, MD1,2, Ana Luisa Veiga de Sá, MD1, Manuel António Fernandes Traila da Silva Campos, MD3
1Anesthesiology Trainee; 3Consultant Anesthesiologist/Neuroanesthesiologist & Consultant in Emergency Medicine
Department of Anesthesiology, Critical Care & Emergency Medicine, Centro Hospitalar do Porto, Porto, Portugal
2Emergency Physician in Pre-Hospital Emergency Services at Instituto Nacional de Emergência Médica in Porto, Portugal.
Correspondence: Dr Joana Barroso Moreira, Department Anesthesiology, Critical Care & Emergency Medicine, Centro Hospitalar do Porto, Largo Professor Abel Salazar, 4099-001 Porto, (Portugal); Phone: +351 962519446; E-mail: joana.b.mor@gmail.com
ABSTRACT
Status epilepticus (SE) represents a diagnostic and treatment challenge in comatosed patients. This clinic report represents one of the first descriptions of the use of Bilateral BIS® monitor to depict the changes of colour density spectral array (CDSA) from the operating room to the intensive care unit (ICU), and allowed us to hypothesize about the presence of epileptiform activity.
A 45 years old man submitted to an urgent craniotomy directed to decompress a malignant middle cerebral artery infarct. Initial CDSA panel showed a pattern of asymmetry, related to the left hemisphere, where the ischemic-hemorrhagic lesion was located. A pattern of high power at frequencies under the 12Hz range was observed, resulting in a plateau formation that can imply seizure presence. This pattern responded to changing of Ce of target controlled infusion (TCI) Propofol and to a bolus of thiopental. At encephalic decompression a global reduction of activity at all frequencies was observed. The patient was transferred to the ICU where the DSA panel showed a sudden loss of alpha and then delta band frequencies. Cerebral death was afterwards clinically diagnosed. CDSA can be used as a complementary tool to detect and monitor SE. It shows good correlation with surgical events and anesthetic depth making it possible to tailor anesthesia to each patient needs in the operating room and in the ICU.
Key words: Status epilepticus; Electroencephalography; BIS; Colour density spectral array; Craniotomy; Middle cerebral artery infarct; Propofol; Thiopental; Intensive Care Unit; Brain death
Citation: Moreira J, Veiga de Sá A, Traila Campos M. The colour density spectral array in the perioperative management of urgent craniectomy: can we identify epileptiform activity? Anaesth Pain & Intensive Care 2017;21(1):79-86
Abbreviations: ASYM – Asymmetry Indicator; BIS – bilateral bispectral index; CDSA – colour density spectral; array; Ce – effect site concentration; cEEG – continuous electroencephalogram; CT – Computed tomography; ECG – electrocardiography; EEG – electroencephalogram; GABA-A – gamma-aminobutyric acid – A receptor; ICU – intensive care unit; NCSE – non-convulsive status epilepticus; NIHSS – Health Stroke Scale; PO – oral administration; qd – daily; SE – Status epilepticus; TCI – target controlled infusion
INTRODUCTION
Status epilepticus (SE) is a potentially life-threatening condition and a common neurological emergency defined as continuous or recurrent seizures lasting more than 5 minutes and without full recovery of consciousness between seizures. SE is categorized as either convulsive or non-convulsive (NCSE).1,2 NCSE presents as a diagnostic challenge as it includes a heterogeneous spectrum of presentations that might be broadly defined as ongoing seizure activity for at least 30 minutes without major motor signs but with a change in behaviour or cognition.1
Permanent neurological damage and death might occur after 20-30 minutes of continuous seizure activity, making early diagnosis and aggressive management of this condition of paramount importance. Although the diagnosis of NCSE is most often suspected on the basis of high clinical suspicion, continuous electroencephalogram (cEEG) monitoring is the gold-standard for definitive diagnosis of NCSE in comatose patients.3,4,5 However, this neurophysiologic technique is largely restricted to teaching hospitals and widespread use is limited. Delaying the diagnosis and the anti-epileptic treatment contribute to the worsening of the pre-existing cerebral damage and therefore for a worse prognosis.1
The newest bilateral Bispectral Index (BIS)-VistaTM Monitoring System consists of the BIS-Vista monitor and a bilateral BIS sensor. The electrode placement is designed to capture high-quality EEG signals from both cerebral hemispheres and the monitor records and displays four channels of EEG (two from each side of the brain), allowing the clinician to immediate assessment of dramatic hemispheric differences. One advanced feature of BIS bilateral system is the option of displaying a colour-based density spectral array (CDSA) of processed EEG information.6
Recent studies have stressed that BIS monitoring may be useful in other clinical situations outside anesthesia such as detection of brain death, treatment of refractory status epilepticus and prediction of prognosis in comatose subjects.7,8,9,10 Despite the fact that cEEG remains the gold-standard for diagnosis and monitoring of NCSE it is complex to perform and difficult to interpret by non-specialized clinicians. The use of simplified algorithms such as DSA may facilitate early diagnosis and monitoring of these patients.5
To the best of our knowledge, this clinic report represents one of the first descriptions of the use of Bilateral BIS® monitor to depict the changes of CDSA with surgical events and concentrations of intravenous anesthetic drugs from the operation room to the intensive care unit (ICU). The interpretation of CDSA also allowed hypothesizing about the presence of epileptiform activity in a comatose patient.
CASE REPORT
A 45 years old man was found fallen on the floor by a relative, minutes after being seen in his normal condition (at 9PM, day 0). At the Emergency Service the neurologic examination detected drowsiness, motor aphasia, right homonymous hemianopia, right hemiparesis of the face, arm (grade 1-2) and leg (grade 2) with a National Institutes of Health Stroke Scale (NIHSS) of 22. Cranial computed tomography (CT) showed an occluded left internal carotid artery (Figure 1).
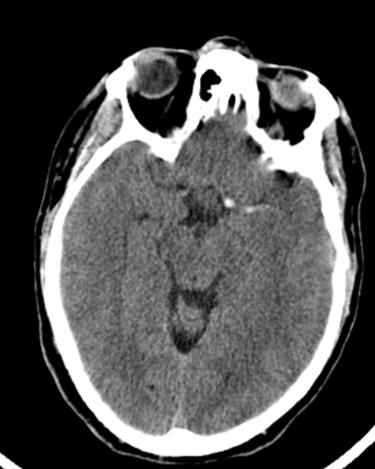
Figure 1: Cranial CT scan showing a hyperdense left internal carotid artery, indicating endovascular thrombus
The patient had a history of epilepsy, not documented, and a depression, being medicated with lamotrigin 200 mg PO qid and duloxetin 30 mg PO qid. He had tabagit habits and no other known pathology or cerebrovascular risk factors.
After an analytic study he was submitted to thrombolytic treatment 3 h after being seen (at 12 PM, day 0).
He was then transferred to our hospital where an angiography was performed, 4h after the thrombolytic treatment was initiated (at 4AM, day 1). It was found that the left internal carotid artery was occluded in its cervical segment owing to arterial dissection and in the petrous segment owing to a thrombus. Mechanical thrombectomy was performed with complete carotid recanalization. Because of the haemorrhagic risk it was decided not to place a stent at the cervical carotid dissection.
In the morning after, a cranial CT was performed that showed ischemic lesions in the superficial and profound left hemisphere in the carotid territory, with some haemorrhagic transformation signals. These lesions conditioned important mass effect with subtentorial herniation and right deviation of the medial structures (Figure 2).
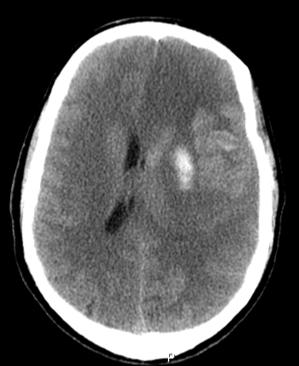
Figure 2: Cerebral Angiography showing occlusion of the cervical and petrous segments of the carotid artery
Under neurosurgery evaluation he was well arousable at call, aphasic and with right body hemiplegia, being proposed for decompressive craniotomy.
Moments after this evaluation he rapidly worsened, Glasgow Coma Scale O1V2M4, anisocoric. Internal Emergency Team performed orotracheal intubation with midazolam 20 mg and vercuronium 10 mg, and the patient was conducted to the operating room.
At the operating room the patient appeared clinically unconscious, showing no responses to either verbal commands or sternal rub, no muscle tone, and eyes fixed in the midline.
We monitored the patient with 5 channel electrocardiography (ECG) , pulse oximetry, continuous direct arterial pressure measurement, bilateral BIS monitor (BIS VISTA; Covidien, Dublin, Ireland), neuromuscular function (Datex-Ohmeda’s M-NMT MechanoSensor, Datex‐Ohmeda Inc., Helsinki, Finland) and end tidal CO2. These values were automatically registered with the Centricity software (Centricity™, GE Healthcare, Chicago, United States). During surgery BIS monitor was connected to hard drive for continuous data collection.
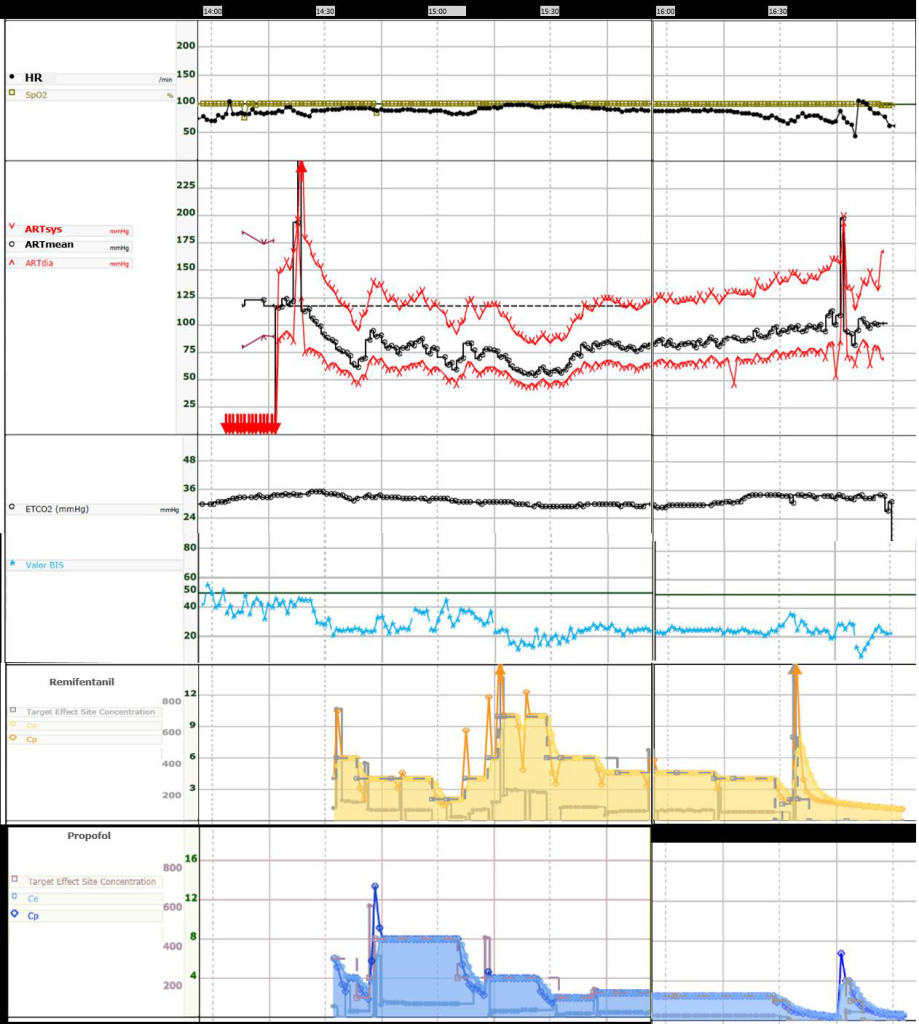
Figure 3: Anaesthesia monitor trends, from the time the patient entered in the operating room to the time it was transferred to the intensive Care Unit.
It depicts continuous Heart Rate (HR), O2 peripheral saturation (SpO2), Systolic (ARTsys), mean (ARTmean) and diastolic (ARTdia) blood pressure from radial 22G arterial line (calibration and movement artefacts are shown at the beginning and at the end).
End tidal CO2 (ETCO2) and Bispectral Index (BIS) values are also shown.
Effect site-concentration (Ce) and plasma concentration (Cp) of Remifentanil (20ug/ml, Minto model, target effect site concentration mode) and of Propofol (10mg/ml, Schnider model, target effect site concentration mode) is also depict with a time lag of 10-15minutes.
An arterial line was placed and continuous systolic, mean and diastolic arterial values were monitored (Figure 3), as the ECG trace (not registered) and heart rate, peripheral saturation, end tidal CO2 and tidal volume (not registered), train-of-four ratio and bilateral BIS.
Initial BIS index values were between 35 and 55, corresponding to the general anesthesia spectrum of values (Figure 3). The Asymmetry Indicator (ASYM), that compares total EEG spectrum power of each side, pointed towards left, the side where the ischemic-hemorrhagic lesion was located. The CDSA right panel showed a slow plus alpha oscillation typical of GABA-A general intravenous anesthetic agents. At the CDSA left panel, we could see an increased power at theta and delta frequencies that accounted for the left tendency in the ASYM values (Figure 4).
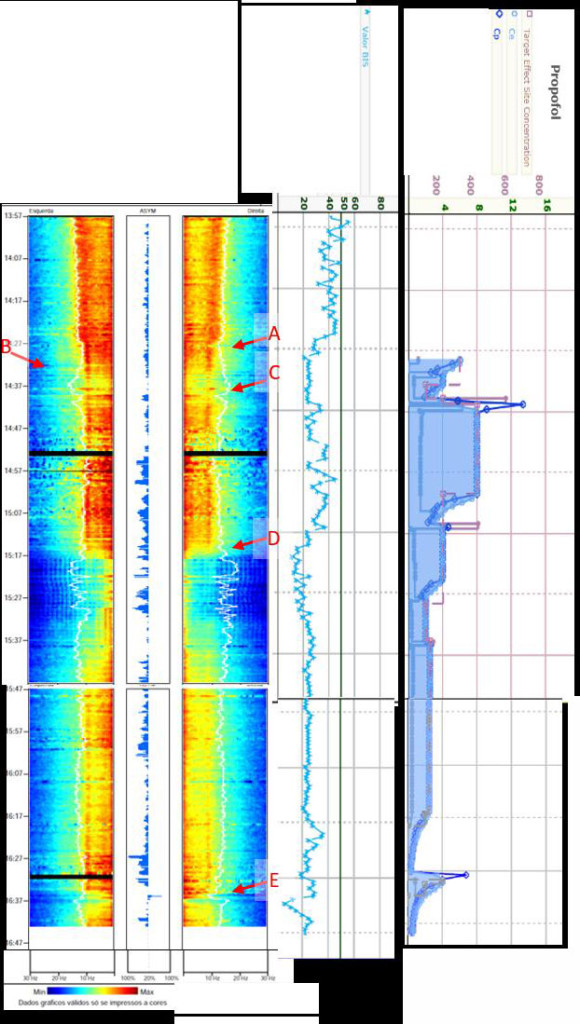
Figure 4: The Colour Density Spectral Array in the operating room.
The patient arrived at the operating room already under a general anaesthesia. Initial Bispectral index value was between 35 and 55 (blue trend line). The Asymmetry Indicator pointed towards left (ASYM). The CDSA right panel showed a typical of GABA-A general intravenous anesthetic agents and the left panel increased power at theta and delta frequencies with a plateau formation. TCI of propofol (10mg/ml, Schnider model) was started with an effect site concentration (Ce) of 6 ng ml1-.
(A) Propofol TCI initial bolus, right CDSA instant reduction of power in all frequencies; (B) increased Ce Propofol to 10, left and right CDSA power reduction in all frequencies, ASYM indicator is reduced. (C) Surgical incision, alpha and slow oscillation power is increased bilaterally, as intermediate frequencies in the left side. (D) Encephalic decompression, at the CDSA panel only slow frequencies remains with high power. (E) 500 mg of thiopental bolus, reduction of activity at all frequencies bilaterally.
A total intravenous anesthesia was performed with Propofol TCI, Schnider Pk/Pd model, and Remifentanil TCI, Minto Pk/Pd Model, using an Orchestra® device (Fresenius Kabi, Brézins, France) and the data were transmitted and registered with Centricity™.
TCI of remifentanil (20 µg/ml, Minto model) was started with an effect site concentration (Ce) of 6 ng/ml and propofol (10 mg/ml, Schnider model) with a Ce of 6 ng/ml. Neuromuscular block was secured with 50 mg of rocuronium (Figure 4, there is a 10-15 min delay in the data transfer from Orchestra® to centricity software, as the drop in the arterial pressure values and the BIS index are effects of propofol and remifentanil infusion).
At point A of the Figure 4 we see the effect of the initial bolus of propofol at right CDSA with instant reduction of the power at all frequencies, not seen at the left side. Remifentanil is initiated at the same time as propofol and can be associated with the bilateral drop in alpha oscillation. Index BIS rounded 20 to 35.
Point B (Figure 4) corresponds to increased propofol Ce from 6 to 10. At both the left and right CDSA panel we can see an instant reduction of the power at all frequencies, with slight time discrepancy. At this propofol concentration ASYM indicator is reduced, the alpha oscillations loses power, remaining the slow oscillation bilaterally.
Surgical incision was the performed at point C (Figure 4), with manipulation artefacts seen at CDSA. Surgical stimuli conducted to augmentation of the alpha plus slow oscillation power, and also at intermediate frequencies in the left side, with ASYM indicator increasing to left side.
At encephalic decompression (point D, Figure 4), return of encephalic vessel pulsatility, hypotension and decreased BIS values were seen. At the DSA panel a sudden change of pattern emerged with only slow frequencies remaining at the highest power, with some burst suppression pattern emerging.
As surgery was approaching its end alpha oscillations were reappearing bilaterally, as were the theta and delta frequencies at the left side.
At point E (Figure 4) a bolus of thiopental 500 mg was administered IV with instant reduction of activity at all frequencies at the left and right panels simultaneously. The patient was then transferred to an ICU under controlled ventilation.
At the ICU, no intravenous drug were given and the patient was monitored with bilateral BIS. The DSA panel showed a similar alpha and slow oscillation frequencies with ASYM value towards left. At point F (Figure 5) sudden loss of power at all frequencies except the slow oscillations (1Hz) was observed. ASYM indicator changed to right, as activity at slow oscillations was greater.
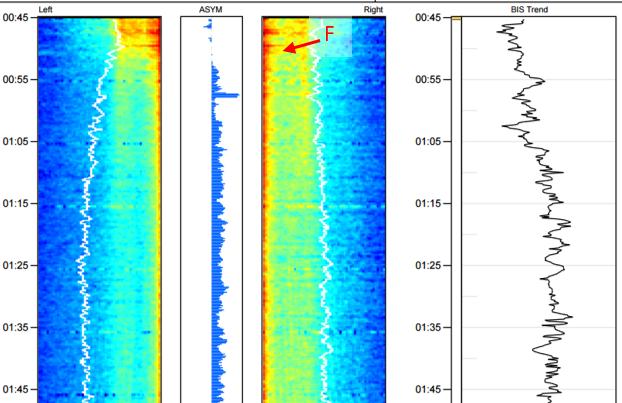
Figure 5: The Colour Density Spectral Array in the Intensive Care Unit.
No intravenous drug was given. The initial CDSA panel shows a similar alpha and slow oscillation frequencies with ASYM value towards left. (F) Sudden loss of power at all frequencies, ASYM indicator changed to right. BIS trend slightly augmented. Afterwards cerebral death was clinically diagnosed.
Cerebral death was clinically diagnosed afterwards.
DISCUSSION
In this case, we report findings in the left CDSA of bilateral BIS that was hypothesized to correspond to SE at left hemisphere potentiated by the ischemic-haemorrhagic massive lesion.
Acute stroke has been reported to cause a great percentage of SE in adults, with intracerebral haemorrhage and cortical lesions being determinants of risk 11.
Detection of non-convulsive seizures requires continuous EEG but, for untrained physicians, cEEG recordings are notoriously difficult to interpret, very time-consuming to read, and artefact identification is sometimes challenging 12,13. The BIS® monitor was developed to assess the hypnotic component of general anesthesia (Johansen, 2006) but its clinical uses have been spreading and there are some case reports that describe the use of the BIS® index to detect non-convulsive seizures.8,14
CDSA EEG applies fast-Fourier transformation to convert raw EEG into a time-compressed and colour-coded display. The sensor uses an electrode montage designed to capture high-quality EEG signals from both of the patient’s cerebral hemispheres. Clinical applications of CDSA and related techniques include identifying seizures in adults and children with good correlation in real time with the underlying raw EEG.13,15,16 Ortega et al6 described a case of an epileptic surgery in witch intraoperative DSA allowed to detect distinctions in the power spectrum between both hemispheres, that BIS index trend failed to detect. As in our case, CDSA evidenced higher alpha and lower frequency power in the affected side suggesting greater sensitivity of this hemisphere to drugs. These differences were also seen by operating changes in propofol dosing. Fernandez Torre et al5 described retrospectively the CDSA of bilateral BIS monitor in 15 patients with comatose NCSE. CDSA during NCSE pattern was characterized by continuous or intermittent red tones in the delta-theta range, with or without asymmetry, and BIS number trend with significant variability.
Propofol, as an antiepileptic drug, used in refractory SE reduced the epileptic activity (point A and B in Figure 6). The goal is to abolish electrographic epileptic activity often requiring burst suppression that can be monitored with good sensibility and specificity with BIS monitor.8
Thiopental confirmed the reduction in epileptic activity response to IV anesthetic drugs as was previously described by similar changes in CDSA in SE.17
Decompressive craniectomy is performed to improve intracranial pressure and cerebral perfusion pressure,18 therefore improving the cerebral concentration of drugs such as propofol resulting, in our case, in a sudden change in CDSA pattern with burst suppression for the same TCI Ce target of propofol. Decompressive craniectomy improves systemic hemodynamic instability 19 but does not remove the stimulus for epileptic activity.20 Therefore pharmacological treatment was continued and monitored post operatively.
This is the first clinical report with CDSA description, from the operation room to ICU. cEEG monitoring is essential for a continuum of care properly tailored to the brain lesion in question. The European Society of Intensive Care Medicine and the American Clinical Neurophysiology Society recommend cEEG monitoring in the critical care units for SE and to monitor the response of seizures and SE to treatment, particular continuous intravenous antiseizure drugs.21,22 BIS index value can be a useful marker for estimating the prognosis of comatose patients in ICU23 and to assessment brain death onset on severely comatose patients24. In 1993 Alster et al25 hypothesized that normal cyclic variations in the EEG are the basis for prognosis as they reflect an intact reticular activating system. A slow monotonous spectrogram was predictive of an unfavourable outcome in comatose patients in 60% of cases. In 2015 Hernandez described the CDSA alterations caused by herniated brain with sudden change in the colour pattern from red-yellow tones in delta-theta frequencies to blue tones in all frequencies brain.26
Despite the limitations of BIS® monitoring in relation to muscle artefacts and the scarcity of parieto-occipital region data, CDSA monitoring can be used as a supplementary tool for monitoring SE, especially in facilities where cEEG monitoring is not available, as in the operating room. It has good time resolution providing continuum monitored treatment tailored to the brain lesion, with instant treatment outcomes.
Acknowledgments: We could not obtained written informed consent from the deceased patient´s next-of-kin for publication of this case report and accompanying images despite all reasonable attempts. Every effort has been made to protect the patient´s identity and there is no reason to believe that our patient would have objected to publication.
Conflict of interest: The author´s declare that they have no significant competing financial, professional or personal interests that might have influenced the performance or presentation of the case described in this manuscript. All the anesthetic materials described belong to the Centro Hospitalar do Porto.
Author contribution:
1. Moreira J., collection of data, analysis of data and writing of the case
2. Veiga de Sá A., analysis of data and writing of the case
3. Traila Campos M., analysis of data and revised article
REFERENCES
1. Shah AM, Vashi A, Jagoda A. Review article: Convulsive and non-convulsive status epilepticus: An emergency medicine perspective. Emerg Med Australas. 2009 Oct;21(5):352-66. doi: 10.1111/j.1742-6723.2009.01212.x. [PubMed]
2. Hernández-Hernández MA, Fernández-Torre JL, Ruiz-Ruiz A, Iglesias-Posadilla D, Gómez-Marcos V, Holanda-Peña MS. Utilidad de la matriz de densidad espectral del sistema de índice biespectral bilateral en la monitorización del status epilepticus no convulsivo. Med Intensiva. 2014;38(4):265-267. [Free full text]
3. Claassen J, Mayer SA, Kowalski RG, Emerson RG, Hirsch LJ. Detection of electrographic seizures with continuous EEG monitoring in critically ill patients. Neurology. 2004;62(10):1743-1748. [PubMed]
4. Levy WJ, Shapiro HM, Maruchak G, Meathe E. Automated EEG processing for intraoperative monitoring: A comparison of techniques. Anesth Analg. 1980;53:223–236. [PubMed]
5. Hernández-Hernández MA, Fernández-Torre JL. Color density spectral array of bilateral bispectral index system: Electroencephalographic correlate in comatose patients with nonconvulsive status epilepticus. Seizure. 2016;34:18-25. doi: 10.1016/j.seizure.2015.11.001 [PubMed]
6. German Ortega SP, Ortega G, Vilà E, et al. Changes in Density Spectral Array of BIS VISTA Monitoring System in Epilepsy Surgery. Int J Neurorehabilitation. 2014;1(3):1-4.
7. Escudero D, Otero J, Muñiz G, Gonzalo JA, Calleja C, González A, et al. The Bispectral Index Scale: Its Use in the Detection of Brain Death. Transplant Proc. 2005;37(9):3661-3663. [PubMed]
8. Musialowicz T, Mervaala E, Kälviäinen R, Uusaro A, Ruokonen E, Parviainen I. Can BIS monitoring be used to assess the depth of propofol anesthesia in the treatment of refractory status epilepticus? Epilepsia. 2010;51(8):1580-1586. doi: 10.1111/j.1528-1167.2009.02514.x [PubMed] [Free full text]
9. Fernández-Torre JL, Hernández-Hernández MA. Utility of Bilateral Bispectral Index (BIS) Monitoring in a Comatose Patient with Focal Nonconvulsive Status Epilepticus. Seizure. 2012;21(1):61-64. doi: 10.1016/j.seizure.2011.09.001. [PubMed]
10. Fàbregas N, Gambús PL, Valero R, Carrero EJ, Salvador L, Zavala E, et al. Can bispectral index monitoring predict recovery of consciousness in patients with severe brain injury? Anesthesiology. 2004;101(1):43-51. [PubMed] [Free full text]
11. Labovitz DL, Hauser WA, Sacco RL. Prevalence and predictors of early seizure and status epilepticus after first stroke. Neurology. 2001;57(2):200-206. [PubMed] [Free full text]
12. Smith CJ, Emsley HCA, Gavin CM, Georgiou RF, Vail A, Barberan EM, et al. Peak plasma interleukin-6 and other peripheral markers of inflammation in the first week of ischaemic stroke correlate with brain infarct volume, stroke severity and long-term outcome. BMC Neurol. 2004;4(1):2. [PubMed]
13. Stewart CP, Otsubo H, Ochi A, Sharma R, Hutchison JS, Hahn CD. Seizure identification in the ICU using quantitative EEG displays. Neurology. 2010;75(17):1501-1508. doi: 10.1212/WNL.0b013e3181f9619e. [PubMed] [Free full text]
14. Tallach RE, Ball DR, Jefferson P. Monitoring seizures with the Bispectral index. Anaesthesia. 2004;59(10):1033-1034. [PubMed] [Free full text]
15. Pensirikul AD, Beslow LA, Kessler SK, Sanchez SM, Topjian AA, Dlugos DJ, et al. Density spectral array for seizure identification in critically ill children. J Clin Neurophysiol. 2013;30(4):371-375. doi: 10.1097/WNP.0b013e31829de01c. [PubMed] [Free full text]
16. Friedman DE, Schevon C, Emerson RG, Hirsch LJ. Cyclic electrographic seizures in critically ill patients. Epilepsia. 2008;49(2):281-287. [PubMed] [Free full text]
17. Hernández-Hernández MÁ, Iglesias-Posadilla D, Ruiz-Ruiz A, Gómez-Marcos V, Fernández-Torre JL. Colour Density Spectral Array of Bilateral Bispectral Index in Status Epilepticus. Anales de Pediatría.2016;85(1):44-47. [Free full text]
18. Slotty PJ, Kamp MA, Beez T, Beenen H1, Steiger HJ1, Turowski B, et al. The influence of decompressive craniectomy for major stroke on early cerebral perfusion. J Neurosurg. 2015;123(1):59-64. doi: 10.3171/2014.12.JNS141250. [PubMed]
19. Colton K, Yang S, Hu P, Chen H, Scalea T, Stein D. Hemodynamic changes after decompressive craniectomy for intracranial hypertension. Crit Care Med. 2014;42(12).
20. Santamarina E, Sueiras M, Toledo M, Guzman L, Torne R, Riveiro M, et al. Epilepsy in patients with malignant middle cerebral artery infarcts and decompressive craniectomies. Epilepsy Res 2015;112: 130–136. doi: 10.1016/j.eplepsyres.2015.02.016. [PubMed]
21. Herman ST, Abend NS, Bleck TP, Chapman KE, Drislane FW, Emerson RG, et al. Consensus statement on continuous EEG in critically ill adults and children, part I: indications. J Clin Neurophysiol. 2015 Apr;32(2):87-95. doi: 10.1097/WNP.0000000000000166. [PubMed] [Free full text]
22. Claassen J, Taccone FS, Horn P, Holtkamp M, Stocchetti N, Oddo M. Recommendations on the use of EEG monitoring in critically ill patients: consensus statement from the neurointensive care section of the ESICM. Intensive Care Med. 2013 Aug;39(8):1337-51. doi: 10.1007/s00134-013-2938-4. [PubMed]
23. Dou L, Gao H-M, Lu L, Chang W-X. Bispectral index in predicting the prognosis of patients with coma in intensive care unit. World J Emerg Med. 2014;5(1):53-6. doi: 10.5847/wjem.j.1920-8642.2014.01.009. [PubMed] [Free full text]
24. Vivien B, Paqueron X, Le Cosquer P, Langeron O, Coriat P, Riou B. Detection of brain death onset using the bispectral index in severely comatose patients. Intensive Care Med. 2002;28(4):419-425. [PubMed]
25. Alster J, Pratt H, Feinsod M. Density spectral array, evoked potentials, and temperature rhythms in the evaluation and prognosis of the comatose patient. Brain Inj. 1993;7(3):191-208. [PubMed]
26. Hernández-Hernández MÁ, Fernández-Torre JL, Ruiz-Ruiz A, Holanda-Peña MS. Color density spectral array in brain herniation. Rev Esp Anestesiol Reanim. 2015;62(1):58-59.
