
Aashish Jain, DA, DNB1, Madhav Swaminathan, MD2
1Anesthesiologist, Asaf Harofeh Medical Center, (Israel)
2Professor of Anesthesiology, Clinical Director, Cardiothoracic Anesthesiology & Critical Care Medicine, Duke University Health System, Durham, NC 27710, (USA)
Correspondence: Dr. Aashish Jain, E-501, Mahindra- Aura, New Palam Vihar, Dwarka Expressway, Gurgaon, (India); Phone: 0091-9818916998(m); E-mail: aashishjain29@gmail.com
ABSTRACT
Medical practice of ultrasound is constantly expanding. It is now used for not only screening and diagnosis of various diseases, but also to enhance care in the field of anaesthesia and intensive care. Ultimately, the quality of care depends on imaging quality. Practitioners of ultrasound therefore need to understand the physics and principles behind the technology in order to create optimal images. In this article, we will remain focused on the basic principles of physics and their applications in the relevant clinical practice.
Key words: Ultrasound; Image; Physics; Physical principles
Citation:
Jain A, Swaminathan M. Physics of ultrasound. Anaesth Pain & Intensive Care 2015;19(4):533-539
INTRODUCTION
Ultrasound waves represent sound waves that exceed normal human audible frequency range of 20 to 20,000 Hertz. All sound waves are comprised of mechanical vibrations transmitted through a solid, liquid or a gaseous medium. Therefore, sound deflects the particles of a medium in the same direction, and itself travels as a longitudinal wave with alternating areas of compression and rarefactions. An ultrasound system consists of a transducer containing piezoelectric crystals made of lead zirconite, which generate an ultrasound wave when stimulated by application of an electrical current. These waves travel through a medium into which they are directed. While a proportion of the transmitted energy is dissipated, some signals are propagated, some scattered and some reflected back to the transducer. The returning reflected waves are processed and then displayed as an image depending on the echogenic characteristics of these signals. In the following text, the principles of ultrasound generation and physical properties governing image creation are discussed, with appropriate examples.
PHYSICAL PROPERTIES OF ULTRASOUND
Frequency:
By definition, ultrasound represents sound waves that exceed the human audible frequency range of 20 to 20,000 hertz (Hz). Hertz is the unit of frequency (‘cycles per second’). In clinical medicine, ultrasound waves are transmitted through body tissues while reflected signals are processed to generate images of internal structures in real time. Diagnostic ultrasound uses the frequency in the range of 1-10 million (mega) Hz. Higher frequencies have superior spatial resolution. Higher frequencies in the range of 5-15 Hz are used for identifying superficial structures, while lower frequencies in the range of 2-5 Hz used to locate deeper structures. Higher frequency transducers are used for transesophageal echocardiography and superficial surface structures while lower frequency transducers are used for transthoracic echocardiography.
Wavelength:
The distance between two identical points in a cycle is known as the wavelength. This distance is from a point of peak compression to the next point of peak compression.
Relationship between frequency and wavelength:
Frequency is inversely proportional to wavelength, therefore, higher the frequency, shorter the wavelength. High frequencies are easily absorbed by superficial structures and cannot penetrate deeper while the lower frequencies have longer wavelengths and able to penetrate deeper structures. Wavelength is inversely proportional to the frequency and the relationship can be described by the following formula:
f=c/λ (f= frequency, λ=wavelength=propagation velocity)
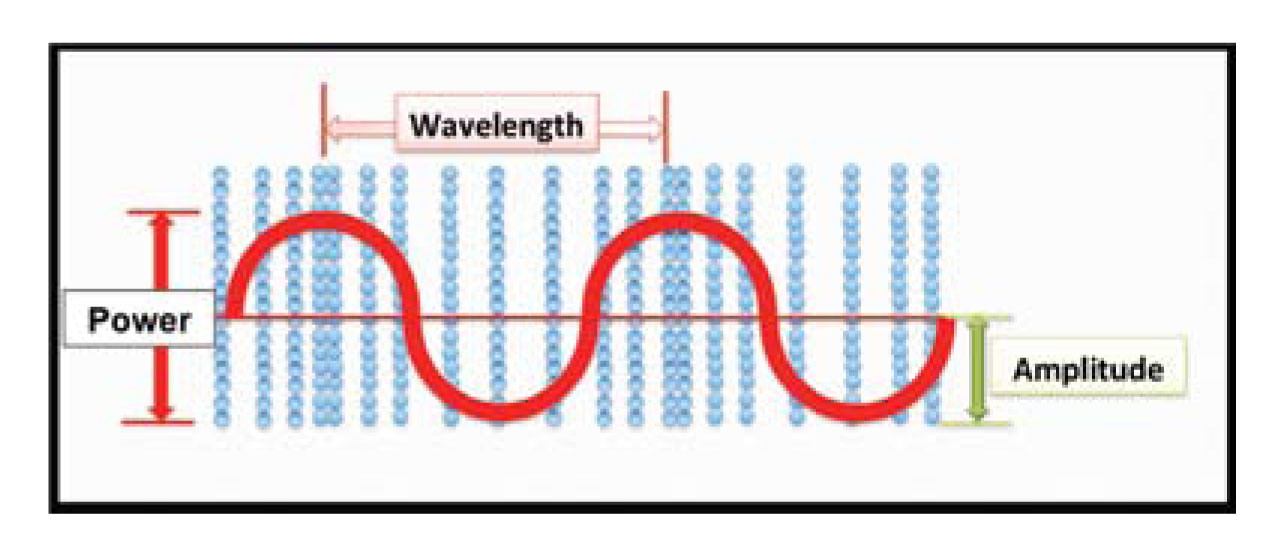
Figure 1: Characteristics of a sound wave. Blue particles indicate areas of particle compression (high energy –crest) and rarefaction (low energy – trough).The horizontal axis is time1
Propagation velocity:
The propagation velocity is the velocity with which a sound wave travels in a medium. In soft tissue, the average propagation velocity of sound is 1,540 meters/second. Propagation velocity also depends on the compressibility and density of a particular medium. More dense structures (e.g. bones) allow faster propagation velocity.
Ultrasound-tissue interactions:
As a sound wave travels, it encounters different structures in its path. The interaction of a sound wave with different structures results in attenuation, defined by absorption, reflection, scattering and refraction.
Attenuation:
Attenuation is weakening of the signals of the sound wave due to absorption, reflection, refraction or scattering.
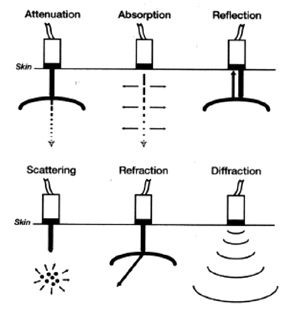 Figure 2: attenuation of the ultrasound beam. The generated beam (dense arrow) weakens (interrupted arrow) as it passes through an absorptive surface2
Reflection:
As a sound wave travels through media of different densities, a fraction of the waves will be reflected at the interface between the two media. The reflected wave towards the transducer is often referred to as the echo. Generation and detection of the echo is the basis of clinical ultrasound. Different media have differing properties that act as a barrier to transmission of ultrasound. This is also known as acoustic impedance, which is the product of density and propagation speed. Large acoustic impedance reflects the sound wave completely and a strong echo is produced. Materials like bones and air have large acoustic impedance. Materials with similar acoustic impedance allow the sound wave with almost negligible reflection Figure 3: The primary beam (dense black line), returns back to the transducer after encountering a reflective surface2
Scattering:
Scattering is the amount of sound wave that reflects but does not return to the transducer. In a true sense, it is the amount of sound wave that is distributed in the surrounding medium in a non-uniform manner. Scattered waves that return to the transducer are known as backscatter. Figure 4: The initial sound wave distributed in the surrounding and does not return to the transducer.2
Absorption:
This refers to the phenomenon of dissipation of a sound wave within the media through which the sound wave travels. Absorption is responsible for the attenuation or weakening of the sound signals.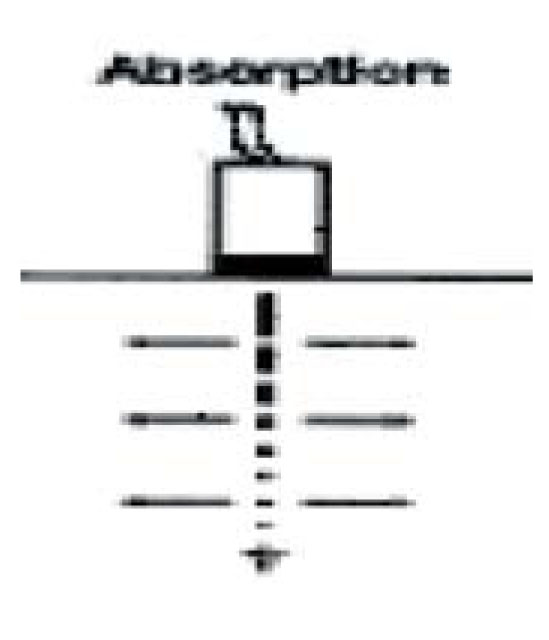 Figure 5: As the primary beam travels in the medium, the sound energy gets absorbed in the surrounding medium. 2
Refraction:
According to Snell’s law “When an ultrasonic wave passes through an interface between two materials at an oblique angle, and the materials have different indices of refraction, both reflected and refracted waves are produced”. Refraction is an important phenomenon to understand and can be illustrated with a familiar example pertaining to refraction with light. When an object such as a pencil in a jar of water appears distorted when seen at an angle due to the differing velocities of light in air and water (the two media traversed by the pencil). The same principle can be applied in ultrasound. Therefore, when the sound wave travels media of different acoustic velocities there are reflected and refracted waves. Snell’s Law describes the relationship between the angles and the velocities of the waves. Snell’s law equates the ratio of material velocities V1 and V2 to the ratio of the sine of incident (Ɵ1) and refracted (Ɵ2) angles, as shown in the following equation.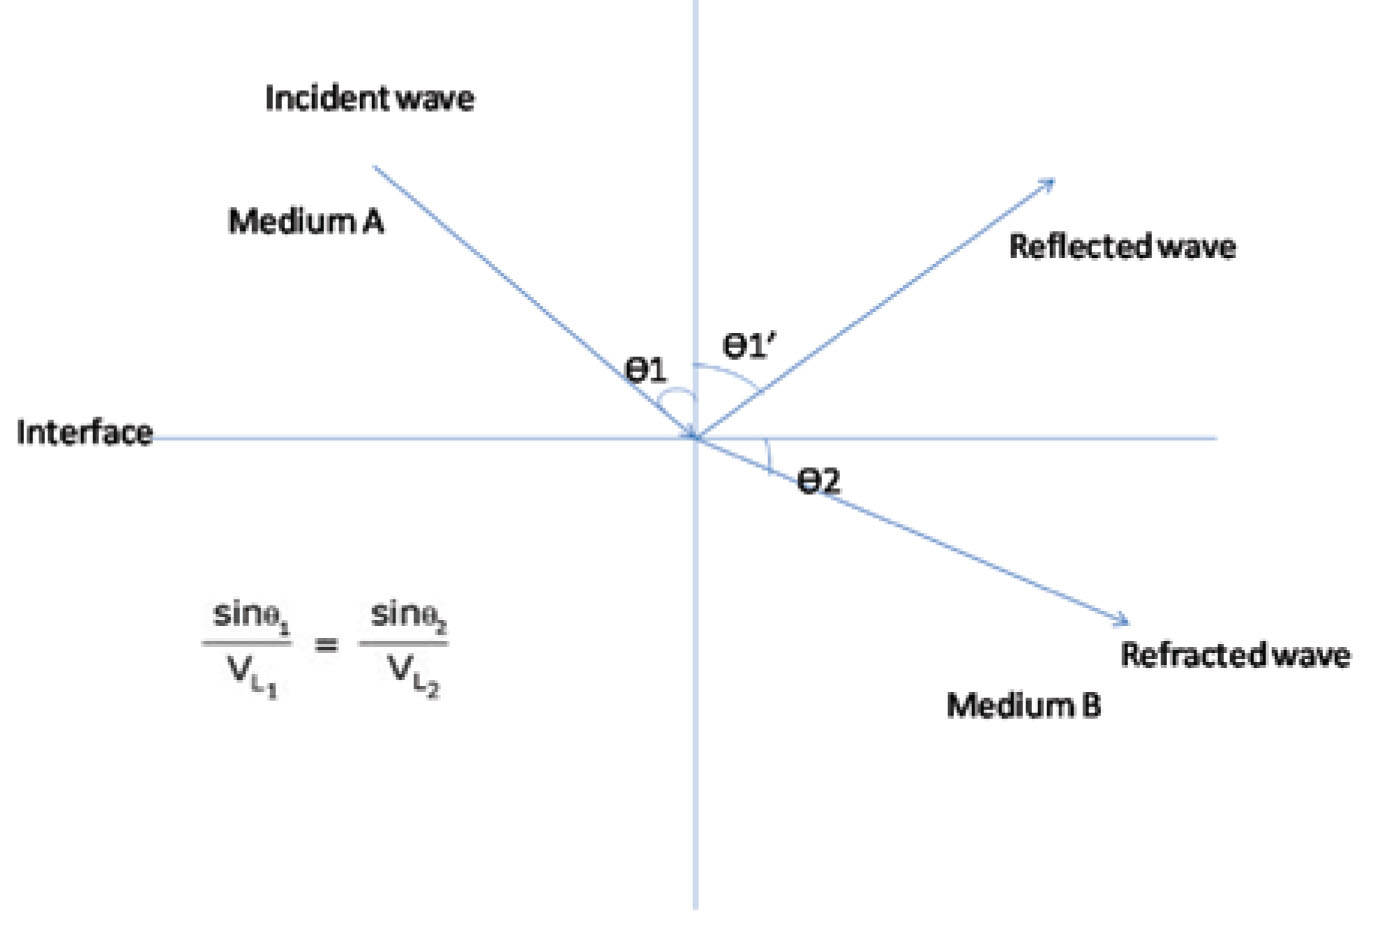 Figure 6: Principle of refraction (Where: VL1 is the longitudinal wave velocity in material one, VL2 is the longitudinal wave velocity in material two)
Note that in the diagram, there is a reflected longitudinal wave (VL1′) shown. This wave is reflected at the same angle as the incident wave because the two waves are travelling in the same material, and hence have the same velocities.
Duty factor:
This factor describes the ratio of the time taken to transmit ultrasound waves to the time spent ‘listening’ to returning signals. In clinical ultrasound, time spent on generating and listening the sound waves is vastly different. Typically, around 99% of time is spent on listening while 1% time is spent on generation of the waves.
Pulse repetition frequency:
All clinical ultrasound uses sound waves that are transmitted in specific pulses. The number of pulses, or a distinct collection of cycles that travel together, generated per second, is known as the pulse repetition frequency (PRF). Since this phenomenon represents pulsed ultrasound, where the propagation velocity of sound in tissue remains constant, the PRF depends upon the imaging depth. The deeper the imaging distance, the lower the PRF, and vice-versa.
Beam:
The ultrasound beam is a collection of waves travelling synchronously after being produced by a number of crystals. The beam can be focused by timing of electrical stimulation (electrical focusing) or steered (electronic steering) in any particular direction. A beam has intensity and acoustic power.
Transducer Orientation:
There is usually a visual or tactile indicator on a hand-held transducer that correlates with a visual indicator of laterality on the display. It helps orient the image with the transducer and determine directionality.
Resolution:
Resolution is the ability to distinguish between two points in space or time, respectively known as spatial or temporal resolution. When considered in two-dimensional imaging, spatial resolution can be along two dimensions, axial (or longitudinal) and lateral.
Axial resolution:
The ability to distinguish two points along or parallel to the ultrasound beam is known as axial or longitudinal resolution. Since axial resolution is primarily governed by the spatial pulse length, increasing the frequency will also increase the axial resolution. This explains why higher frequency transducers have superior spatial resolution compared with lower frequency transducers.
Lateral resolution:
Lateral resolution is ability to distinguish two points perpendicular in orientation to the ultrasound beam. The depth of scanning and width of ultrasound beam affect it. A wider beam and greater depth of scanning reduce lateral resolution, which is better at shallow imaging depth.
Temporal resolution:
This is the ability of the ultrasound beam to accurately determine movement of an imaged object over time. It is also synonymous with the frame rate. Typical frame rate in echo imaging system in between 30 – 100 Hz or frames per second.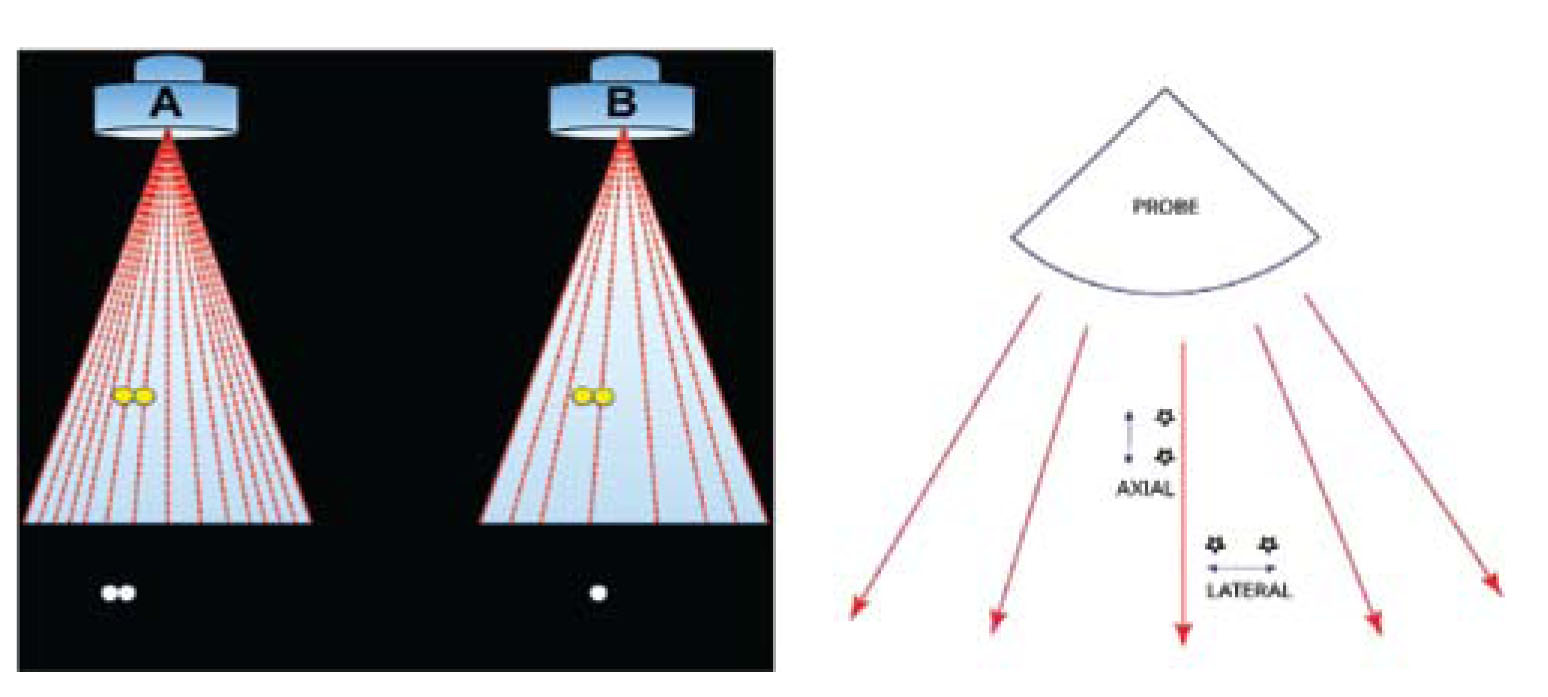 Figure 7A & 7B: Transducer A has a higher scan line density and is therefore able to better appreciate two distinct objects on the display. Transducer B has a lower line density and therefore has inferior lateral resolution.1
Transducer and scan modes:
The transducer is the mechanical part also commonly known as a probe, which has direct contact with tissue and contains piezoelectric crystals of lead zirconate. These crystals produce sound waves when electrically stimulated within the transducer. The second function of a transducer is to interpret the returning sound signals and convert them back into electrical signals that are then displayed on a screen in the form of an ultrasound image. The scanning modes are the following:
‘A’ scan:
A scan or amplitude scan is used to measure the amplitude of returning signals and gives one dimensional information of the depth of the structure to be scanned. A-mode ultrasound is generally used to identify a specific tumor or a calculus.
‘B’ or brightness mode or 2D scan:
This mode provides two-dimensional information in the form of an image of a cross sectional area. In the ultrasound machine, 2D mode is usually set as default initial mode. The image is appears as a sector with curvilinear probe used for analyzing deeper structures for example in abdominal ultrasound, while with linear probes, the image appears as rectangular or trapezoid sector, for example with vascular imaging. Highly reflective structures such as bones appear bright, while low reflective structures like muscles, appear in variable shades of grey and structures with no reflectiveness, such as water or fluid appear dark.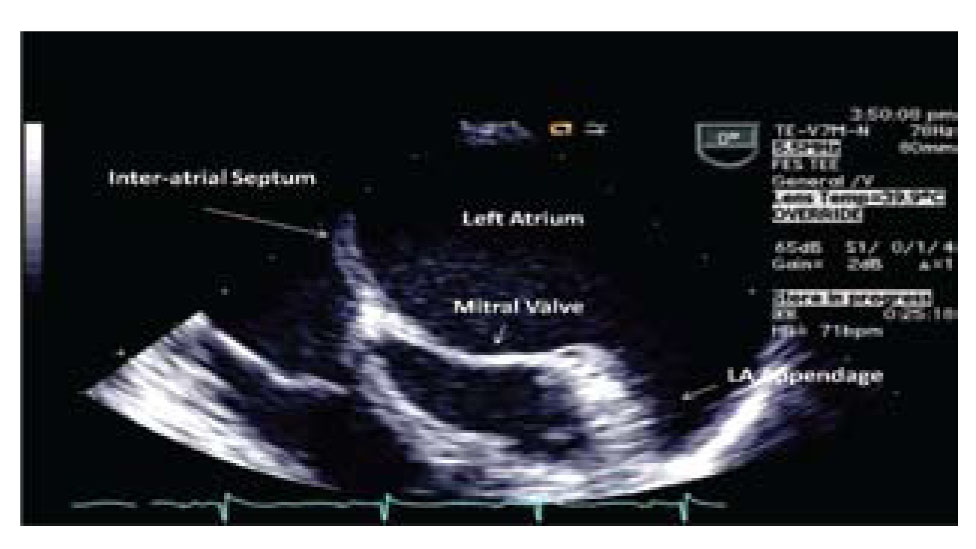 Image 1: 2 D image showing left atrial appendage3
‘M’ mode scan:
In this mode, the scanning is along one line or one axis. The returning signals are displayed as a cross sectional representation of signals over a time course. M mode has good temporal resolution and useful for recording and identifying rapid movements, and especially for making accurate measurements, for example cardiac chamber dimensions and muscle shortening over time to calculate the ejection fraction.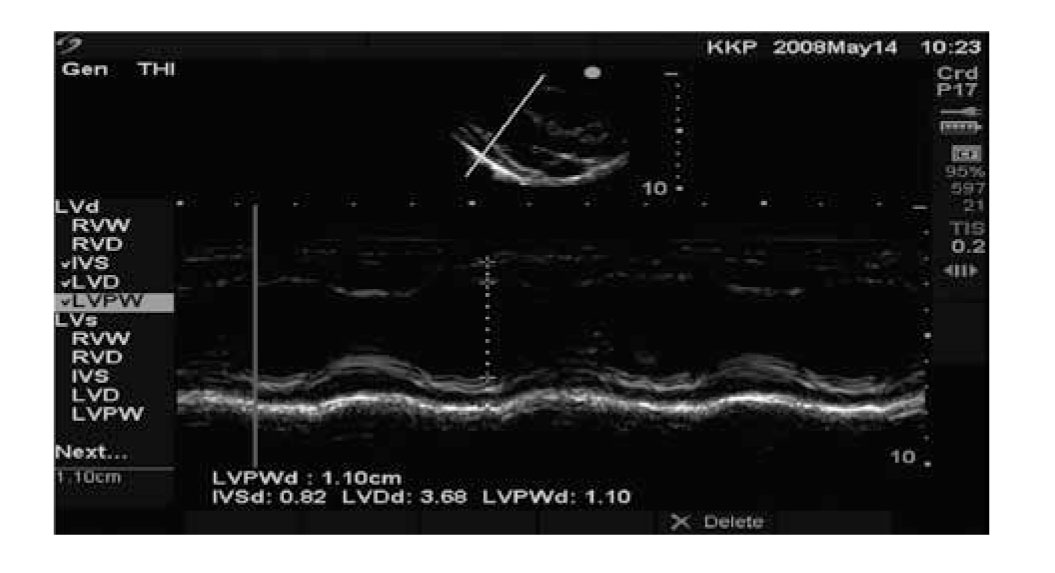 Image 2: An example of M mode through the left ventricle showing movement of the walls over time3
DOPPLER MODES
The Principle:
All modes that use Doppler are based on the Doppler Effect, which is based on work by Austrian physicist Johann Christian Doppler. The Doppler principle states that there is an apparent change in received frequency due to relative motion between a sound source and sound receiver. If the source moves towards receiver, frequency increases and if the source moves away, frequency decreases.
To obtain the more accurate results using ultrasound it is important to understand the Doppler equation and effect of its components on the image obtained. The Doppler equation is as below:
(FR -F T ) = 2F T V Cos θ / C ,
where FR is the received frequency, F T is transmitted frequency, (FR -F T ) is the Doppler shift, V is the velocity of blood flowing towards the transducer Cos θ is the cosine angle of insonation and C the frequency of ultrasound in the tissues.
The cosine of 90° is zero, so if the ultrasound beam is perpendicular to the direction of blood flow, there will be no Doppler shift. It will appear as if there is no flow in the vessel. With the ultrasound beam parallel to the direction of blood flow at an angle of 0°, maximum velocity would be obtained as the cosine of 0° is 1. However the gray scale image quality decreases.
Cosine angle is 0.5 at 60°, which is the median value and therefore, to obtain accurate results, all pulsed Doppler interrogation/sampling should be done at an angle of 60 degrees or less as measured between insonation beam and blood flow direction or vessel wall. Insonation angles greater than 60 degrees should never be used for any data analysis.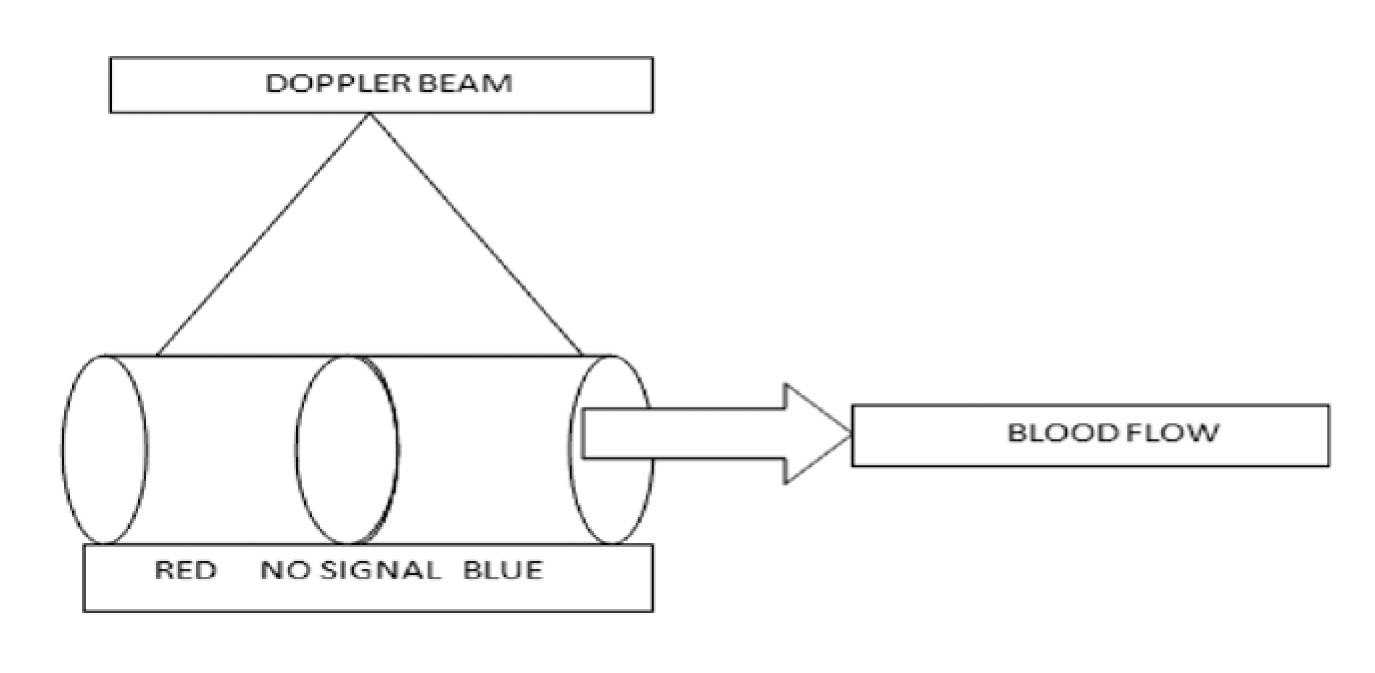 Figure 8: The mid-zone has no signal because the beam is perpendicular to flow. The conventional colour codes are – BART: Blue Away, Red Towards, but can be changed3
Pulse wave (PW):
In the pulse wave Doppler, the information is sampled from only a small sample volume (defined in 2D image), and presented on a timeline. The transducer crystal transmits and records it after a preset delay, this allows it to precisely localize the velocity signals.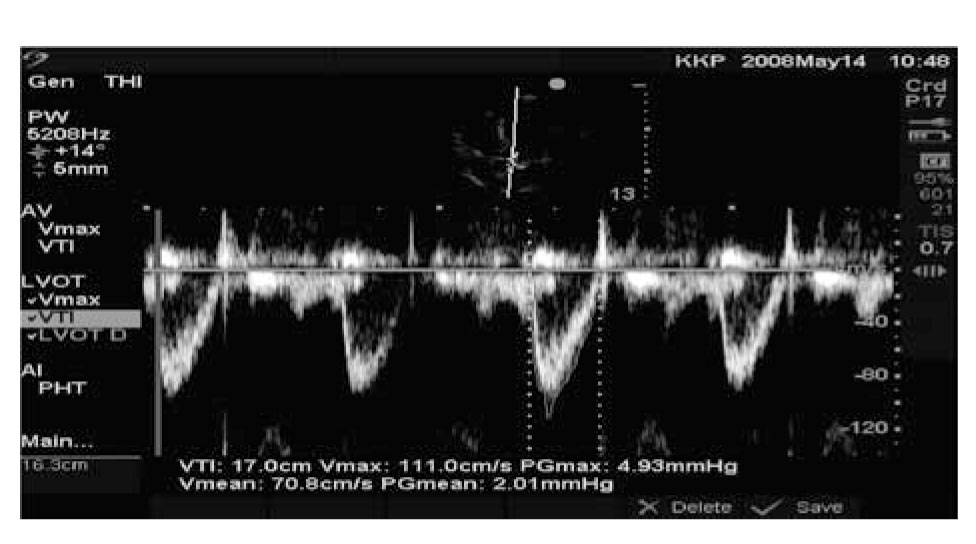 Image 3: An example of Pulsed Wave Doppler of normal flow through the left ventricular outflow tract3
Continuous wave Doppler:
In the continuous wave Doppler, a part of the transducer continuously transmits and a part of the transducer continuously receives Doppler signals along a single line that is placed on the 2-D image.
Color Flow Doppler:
This is flow information as detected by pulsed Doppler superimposed on a 2D image. The pulse wave Doppler signals are used to derive this image. Although it can be changed, generally, the blood flowing towards the transducer appears red and flowing away appears blue. Blood flowing perpendicular appears black while a turbulent flow appears green or white as a mosaic. Color Doppler is a commonly used mode in assessing valvular regurgitant lesions.
Phase Scan:
In the phase scan there are hundreds of transducers in a single probe. It gives us high-resolution real time image. By changing the angle of the wave front, it gives us a 3-D image of a structure over a large surface area.
ARTIFACTS
Artifacts are the imaging errors while using ultrasound. These are generally a result of interactions between sounds and media that lead to inaccurate representation of structures since they usually do not follow anatomical boundaries. While some artifacts can be misleading, some are helpful for diagnoses like stones or pneumothorax. The commonly encountered artifacts are acoustic shadowing, acoustic enhancement, reverberation, mirror effects, comet tail artifacts.
Acoustic shadowing:
Shadowing is an artifact, which appears due to solid reflective structures like a bone or stone. The ultrasound beam can travel beyond this structure and as result; the artifact appears as a shadow.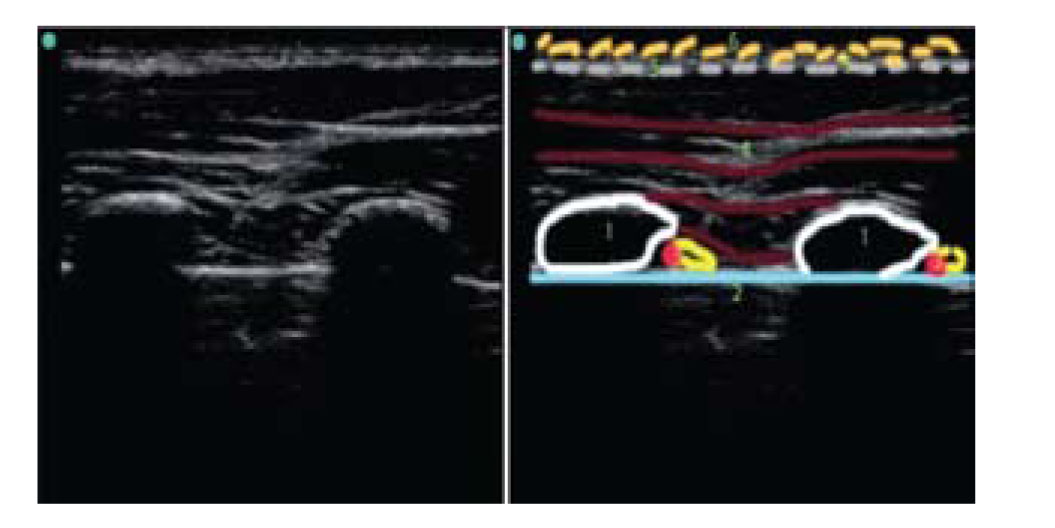 Image 4: Acoustic shadowing in a lung ultrasound. Number 1= ribs, No. 2= Pleura. Dense area behind ribs is due to acoustic shadowing2
Acoustic enhancement:
When there is a change in medium along the path of a beam, through which the ultrasound waves can penetrate easily, there may be a bright-enhanced area distal to the medium that is enhanced. This occurs due to the inherent time gain compensation built into most systems to allow increasing amplitude of signals returning from deeper structures to compensate for attenuation.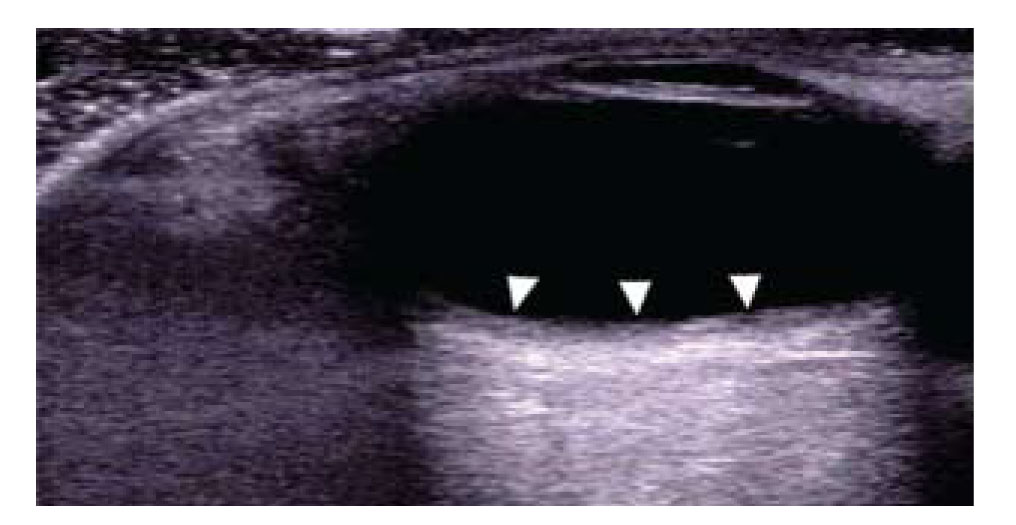 Image 5: Acoustic enhancement. Area behind the vein is bright and enhanced (solid arrows) 2
Reverberation:
Reverberation artifact occurs due the reflection of the beam between two structures of high acoustic impedance, like pleura. The wave moves forwards and backwards between these structures and appears as parallel lines. With deeper imaging, the density of these lines gradually decreases, as the reflected signals become weaker from greater depths. The artifact appears as a striped pattern of these lines with alternating bright and dark areas.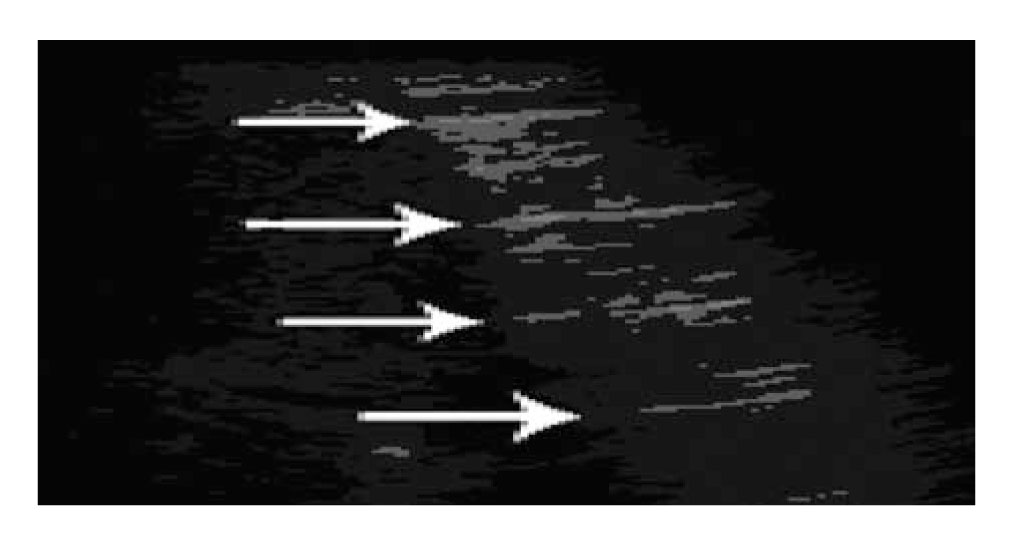 Image 6: Reverberation artifact. Image of lung ultrasound showing reverberation due to pleura. Lines due to pleura, seen in normal lung4
Comet tail artifacts:
The comet tail artifact is due to the interrogation of a highly reflective structure in the path of the ultrasound beam. It is a special form of reverberation artifact.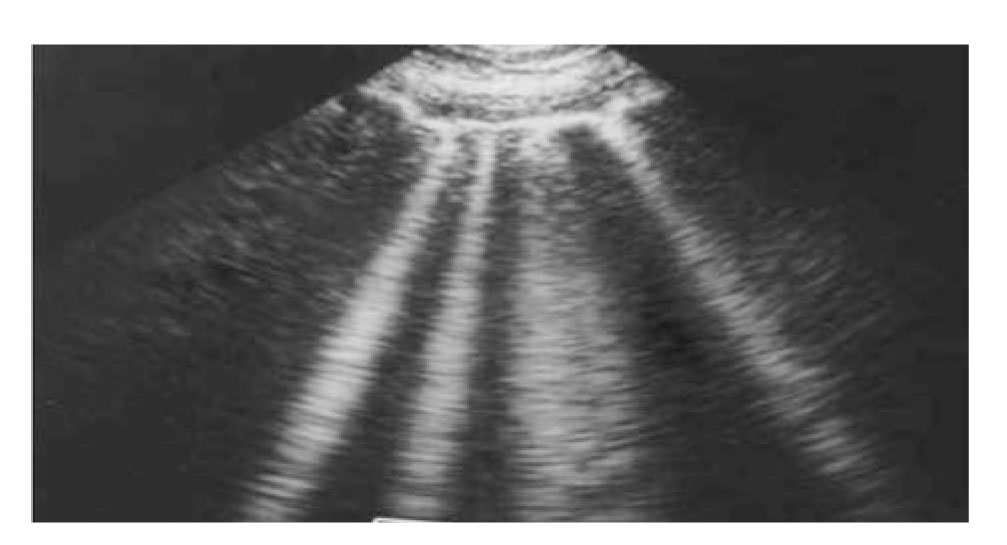 Image 7: Comet tail artifact. Ultrasound of lung showing Comet tail artifact, B lines, seen in pulmonary edema or ARDS5
Mirror image artifact:
This kind of artifact is seen when the ultrasound beam strikes a structure of a high acoustic impedance the similar mirror image appears mimicking a virtual object, for example in case of diaphragm. The mirror image is more hypoechoeic than the actual structure.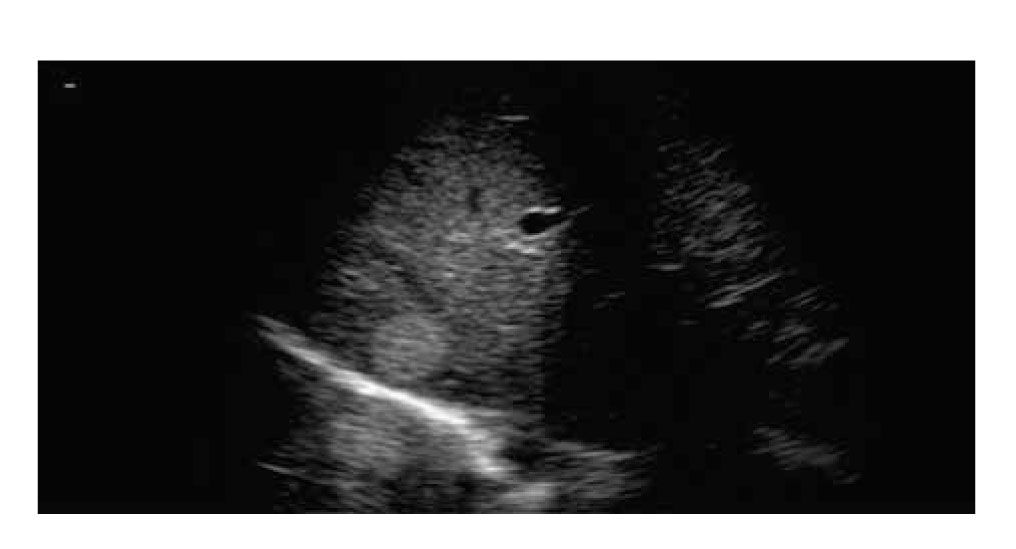 Image 8: Mirror artifact: The primary ultrasound bean is reflected from a highly reflective surface of diaphragm (bright hyper echoic) but in the returning path it encounters another structure like a nodular lesion (rounded structures) before it finally reaches back to the transducer, creating a mirror image artifact4
SUMMARY
Knowledge of the principles and physical properties of ultrasound is important in order to make meaningful use in its day-to-day clinical application. It is helpful for accurate interpretation of the information provided by the ultrasound. A routine practice based on scientific knowledge is essential to adopt accurate clinical judgments. As the efforts are continued, in future we can expect much more advancements in the technology and precision of image acquisition with much wider areas of ultrasound application.
Conflicts of interest: None
BIBLIOGRAPHY
Refferences
- Swaminathan -Ultrasound-physics-SCA 2015-syllabus2
- Tutorial 1 – Basic physics of ultrasound and the Doppler phenomenon.
- Tutorial 2 – Modes of Ultrasound.
- Michael Macias. ULTRASOUND LEADERSHIP ACADEMY: LUNG ULTRASOUND, November 13, 2014.
- Dennison S, Fahlman A, Moore M. The use of diagnostic imaging for identifying abnormal gas accumulations in cetaceans and pinnipeds. Front Physiol. 2012 Jun 6;3:181.
[PubMed] [Free full text] doi: 10.3389/fphys.2012.00181. eCollection 2012.
- Teodorescu V, Gustavson S, Schanzer H. Duplex Ultrasound Evaluation of Hemodialysis Access: A Detailed Protocol. Int J Nephrol.2012;2012:508956.
[PubMed] [Free full text] doi:10.1155/2012/508956
*references are either open access or the permission for images and relevant text has been taken for this article.
