
Madiha Hashmi, FFARCSI*, Ali Asghar, FCPS*, Saima Rashid, MBBS**, Fazal Hameed, FCPS***, Hameedullah, FCPS****
*Assistant Professor; **Resident; ***Professor, ****Associate Professor
Department of Anesthesiology, Aga Khan University, Stadium Road, Karachi, 74800 (Pakistan)
Correspondence: Dr. Madiha Hashmi, Assistant Professor,Aga Khan University, Stadium Road, P.O. Box 3500, Karachi-74800 (Pakistan); Fax number: (92-21) 34934294, 34932095; E-mail: saima.rashid@aku.edu
ABSTRACT
Purpose: Performance of prognostic models deteriorates over time by changes in case-mix and clinical practice. This study was conducted to describe the case-mix of a surgical intensive care unit (SICU) and assess the performance of APACHE II scoring system in this cohort.
Methodology: We analyzed 213adult patients admitted to the surgical intensive care unit (SICU) of Aga Khan University Hospital, from January 2011 to December 2012 and the performance of APACHE II scoring system was assessed in this population.
Results: The mean age of patients was 46.31 years (SD ±18.43), 67.1% patients were male and mean length of ICU stay was 6.54 days (SD ± 7.18).Admissions to SICU were from seven service departments with the highest admissions from general surgery followed by trauma and neurosurgery. The mean APACHE II score of this SICU population was 15.89 (SD ±8.06), 12.88 (SD ±6.29) in survivors and 22.24 (SD ±7.66) in non-survivors (p <0.01). The overall mortality was 33%, with SMR of 1.0. No patient survived with an APACHE II score of more than 34. In this SICU population the calibration and discrimination of the APACHE II scoring system was acceptable, i.e. [(H-LS 11.76 (p=0.16)] and (area under the receiver operating curve = 0.83).
Conclusion: APACHE II scoring system allows meaningful analysis of SICU population, therefore, it is recommend, that this simple and cost effective scoring system should be used to identify patients with high risk of death to justify the decisions of withholding expensive therapies in resource limited settings.
Key words: Intensive care unit; Acute Physiology and Chronic Health Evaluation; APACHE II; Severity of Illness Index; ROC Curve
Citation: Hashmi M, Asghar A, Rashid S, Khan FH. APACHE II analysis of a surgical intensive care unit population in a tertiary care hospital in Karachi (Pakistan). Anaesth Pain & Intensive Care 2014;18(4):338-44
INTRODUCTION
Prognostic models have been used to stratify the severity of disease and predict case-mix adjusted probability of death in adult intensive care units for three decades.1 Such measurements help in clinical decision making,1 standardize research,2 provide a benchmark to compare the quality of patient care across ICUs,3 facilitate appropriate resource utilization,4 and estimate the cost of intensive care,5 The modified version of Acute Physiologic and Chronic Health Evaluation scoring system (APACHE II) developed by Knaus et al in 19856 is the most widely used scoring system globally.1 It accurately stratifies risk of death in a wide range of disease states and in different clinical settings.3 It is based on age, worst values of routinely collected physiologic and laboratory data in first 24 hours after admission to the intensive care unit, and presence or absence of chronic organ dysfunction.
The performance of prognostic models deteriorates over time due to changes in case-mix and clinical practice,7and it is recommended to assess their performance1 and update the older models periodically.8,9 Literature review of last twenty years reveals a handful of studies conducted in mixed and medical ICUs across Pakistan to assess the impact of disease severity on outcome.10-12 APACHE II analysis of surgical intensive care unit (SICU) population has not been previously reported from the country. The aim of conducting this retrospective study was to (i) describe the case-mix of adult SICU of a tertiary care hospital in Karachi, Pakistan (ii) assess the performance of APACHE II scoring system in this cohort of SICU patients.
METHODOLOGY
This retrospective observational study included all consecutive adult (non-cardiac) admissions to the surgical intensive care unit, at the Aga Khan University Hospital Karachi (Pakistan) from January 2012 to December 2013. The study was exempted for review from the institutional ethical review committee. Cases with an incomplete record of physiological variables, chronic health status or age, death or discharge from ICU earlier than 24 hours and documentation of do not resuscitate orders within 24 hours of admission, were excluded from the study. In case of re-admission, only the first admission was considered.
Demographic data, presence or absence of any chronic heart, lung, liver or kidney disease or immunosuppression, source of admission (operating room, emergency room, surgical floor and other), type of admission (elective surgery, emergency surgery or non-operative) and service department, were recorded on the data collection form, from the patient’s file. The worst physiological variables documented on the ICU flow sheet during the first 24 hours from the time of admission to the ICU were entered in a separate form (APACHE II Form) to calculate the acute physiology score (APS). The physiological variables included, temperature, mean arterial pressure, heart rate, respiratory rate, arterial pH (or bicarbonate if arterial blood gas analysis was not done), sodium, potassium, creatinine, hematocrit, total white blood cell count, PaO2, FiO2, PaCO2 and urine output in 24 hours. Glasgow coma scale as documented in the observation sheet was recorded. In patients who were intubated or received sedatives or neuromuscular blocking agents, the pre-intubation score was taken if documented in the notes, otherwise it was presumed to be normal. Date of discharge from or death in ICU was noted and length of ICU stay was calculated. An expert scorer not involved in data collection used the manual gold standard form to assign a score to physiological variables (A), age (B), and presence or absence of chronic illness (C). A + B + C = APACHE II score.
All statistical analysis was performed using Statistical Package for Social Science version 19 (SPSS Inc., Chicago, IL). Primary outcome variable was ICU mortality and independent variables were APACHE II score, source of admission, service department, type of admission, age of the patient and the length of ICU stay. Frequency and percentage were computed for qualitative observation and analyzed by chi-square test. Mean and SD were estimated for quantitative observation and analyzed by t-test after fulfillment of normality assumption, otherwise Mann-Whitney U test was used. Logistic regression analysis was performed to estimate the probability of ICU mortality by using APACHE II score. Receiver operating characteristic curve (ROC) was also used for model discrimination. A value of 0.5 meant that the model was useless for discrimination. Hosmer-Lemeshow statistics was used for goodness of fit and calibration respectively. The standardized mortality ratio (SMR) was calculated and the difference between observed and predicted number of ICUs deaths was analyzed. A p-value ≤0.05 was considered significant. By using the model, expected death was generated with respect to source of admission, type of admission and service department, and then SMR was estimated.
RESULTS
Patient Characteristics: Five hundred and forty seven surgical admissions in two years, from January 2011 till December 2012 were evaluated. 334 (61%) patients were excluded from the study due to missing files, incomplete data recorded, patient’s ICU stay less than 24 hours or do not resuscitate (DNR) orders within first 24 hours. The study group, therefore, consisted of 213 patients. The patients were admitted by the primary surgeons representing 7 departments as shown in Table 1.
Table 1: Characteristics of the patients on admission to the ICU (n=213)
| Source of admission [n (%)] Operation Room Emergency Room Hospital Ward Other |
153(71.8%) |
| Type of Admission [n (%)]Emergency Surgery Elective Surgery Non Post-Operative |
131(61.5%) |
| Service Department [n (%)]General Surgery Neuro Surgery Trauma Obstetrics and Gynecology Urology Orthopedic Cardiothoracic surgery Vascular |
69(32.4%) |
| APACHE Score [mean (SD)] ICU Stay days [mean (SD)] |
[15.96(±8.06)] |
Patients with multiple trauma were admitted in the service of more than one department, therefore for clarity, if the primary reason for admission to the SICU was trauma, the patient was counted in the group designated “trauma” and was not counted in any service department. Patients arrive in SICU from operating room (OR) after emergency or elective surgery, emergency room (ER), either for stabilization before an urgent surgery or conservative management, and from the surgical floors. The “other” group included patients transferred from another hospital or another ICU.
Table 2: Comparison of characteristics between male and female
|
Variables |
Males |
Females> |
| Age (Yrs.) |
46.06 ± 17.89 |
46.84 ± 19.76 |
| APACHE Score |
16.66 ± 8.27 |
14.53 ± 7.49 |
| ICU Stay (days) |
5.91 ± 6.79 |
7.83 ± 7.81 |
|
Source of admission |
||
| Operating Rooms |
106(74.1%) |
46(65.7%) |
| Emergency Room |
27(18.9%) |
9(12.9%) |
| Hospital Ward |
10(7%) |
13(18.6%) |
| Other |
0(0%) |
2(2.9%) |
|
Type of Specialty |
||
| General Surgery |
42(29.4%) |
27(38.6%) |
| Neurosurgery |
30(21%) |
19(27.1%) |
| Trauma |
61(42.7%) |
5(7.1%) |
| Obstetrics and Gynecology |
0(0%) |
14(20%) |
| Urology |
7(4.9%) |
2(2.9%) |
| Orthopedic |
2(1.4%) |
2(1.4%) |
| Cardiothoracic surgery |
0(0%) |
1(1.4%) |
| Vascular |
1(0.7%) |
0(0%) |
| Mortality |
49(34.3%) |
21(30%) |
143 patients were male (67.1%) and 70 female (32.9%). As shown in Table 2 there was no statistically significant difference between the two regarding age, mean APACHE II scores, length of ICU stay or mortality, but out of 66 patients admitted with trauma, 61 (92.4%) were male and 5 were female (7.6%).
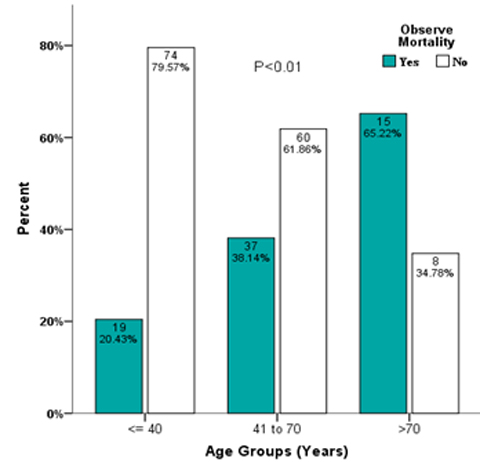
Average age of patients admitted to SICU was 46.31 ± 18.43 (ranging from 16-85). Ninety two patients (43.19%) were < 40 years old and 74 (80.43%) of these patients survived. The other ninety seven 97 (45.53%) patients were 41 to 70 years old and 60 (61.85%) survived. Only 24 (11.26%) patients were > 70 years old and out of these only 9 (37.5%) survived. Significant association (p = 0.01) of age with outcome was observed. Figure 1.
Figure 1: Association of age with outcome (n= 213)
Severity of illness &length of stay:
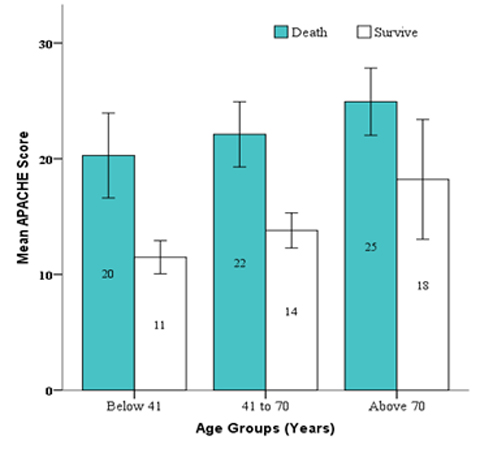
The mean APACHE II score of this cohort of patients as calculated by an expert scorer using the gold standard manual technique was 15.96 ± 8.06. The mean score in patients who were discharged alive from the SICU was 12.88 ± 6.29 and 22.24 ± 7.66 in patients who died in SICU. Figure 2 shows the comparison of APACHE II score between survivors and non-survivors according to the three age groups.
Figure 2: Comparison of APACHE score between survivor and non-survivor according to age groups
The sickest patients as indicated by the highest mean APACHE II score belonged to the service of urology (mean APACHE II score =20.11 ± 11.81), were those who were admitted to SICU from the surgical floor (mean APACHE II scores =19.63 ± 9.87) and the non-operative group with no surgical procedure done in the previous 48 hours (mean APACHE II score = 17.41 ± 9.23).
The mean length of SICU stay was 6.59 days. A significant difference (p = 0.05) was observed in mean ICU stay between those who survive (5.57 ± 5.84 days) and those who died (8.51 ± 9.07). There is a significant correlation (r =0.188, p= 0.006) between APACHE II score and length of stay.
Risk of ICU death:
The observed overall ICU mortality was 33.3%. Dividing observed mortality by predicted mortality gives the mortality ratio also known as standardized mortality ratio (SMR) which was 1.00.
Tables 3, 4 and 5 show the observed and predicted ICU mortality along with the SMR, according to the service department, source of admission and type of admission.
Table 3: Relationship between APACHE Score and Predicted Probability of death according to service department
|
Service |
n |
Observed Death |
% Observed Death |
Expected death |
% Expected Mortality |
Mortality Ratio |
| General Surgery |
69 |
27 |
39.1% |
28 |
40.6% |
0.96 |
| Neurosurgery |
49 |
15 |
30.6% |
13 |
26.5% |
1.15 |
| Trauma |
66 |
19 |
28.8% |
21 |
31.8% |
0.95 |
| Obs & Gyne |
14 |
1 |
7.1% |
2 |
14.3% |
0.50 |
| Urology |
9 |
4 |
44.4% |
4 |
44.4% |
1.00 |
| Others |
6 |
4 |
66.7% |
2 |
33.3% |
2.00 |
Others: Orthopedic 4; Cardiothoracic surgery 1; Vascular 1
Predicted probability of Expected death was generated by the basic model: -3.895 + (APACHE II) x 0.184 for each cases and sum according to specialty.
Table 4: Relationship between APACHE Score and Predicted Probability of death according to source of admission
|
Sources |
n |
Observed Death |
% Observed Death |
Expected death |
% Expected Mortality |
Mortality Ratio |
| Emergency Room |
35 |
14 |
40% |
13 |
17.1% |
0.75 |
| Operation Room |
153 |
47 |
30.7% |
47 |
30.7% |
1.02 |
| Hospital Ward |
23 |
9 |
39.1% |
10 |
43.5% |
1.00 |
| Other |
2 |
0 |
0% |
0 |
0 |
0 |
Predicted probability of expected death was generated by the basic model: -3.895 + (APACHE II) x 0.184 for each cases.
Table 5: Relationship between APACHE Score and Predicted Probability of death according to type of admission
|
Operative vs. |
n |
Observed Death |
% Observed Death |
Expected death |
% Expected Mortality |
Mortality Ratio |
| Elective |
23 |
3 |
13% |
4 |
17.4% |
0.75 |
| Emergency |
131 |
47 |
33.6% |
43 |
32.8% |
1.02 |
| No operative |
59 |
23 |
39% |
23 |
39.0% |
1.00 |
Predicted probability of expected death was generated by the basic model: -3.895 + (APACHE II) x 0.184 for each cases.
Performance of Apache II scoring system in SICU population:
Discrimination is the ability of the model to distinguish between survivals and non-survivals and is measured by the area under the receiver operating characteristic (ROC) curve which was 0.823 in our study (Table 6).
Table 6: Relationship between APACHE Score and Predicted Probability of death
|
APACHE |
n |
Observed Death |
% Observed Death |
Expected |
% Expected Mortality |
SMR |
Difference of Observed and Expected Mortality (%) |
| 0-4 |
10 |
0 |
0.0% |
0 |
0 |
0.0 |
0.0% |
| 5-9 |
48 |
6 |
12.5% |
4 |
8.3% |
1.5 |
4.2% |
| 10-14 |
49 |
4 |
8.2% |
8 |
16.3% |
0.5 |
-8.2% |
| 15-19 |
38 |
16 |
42.1% |
13 |
34.2% |
1.2 |
7.9% |
| 20-24 |
31 |
13 |
41.9% |
16 |
51.6% |
0.8 |
-9.7% |
| 25-29 |
26 |
21 |
80.8% |
19 |
73.1% |
1.1 |
7.7% |
| 30-34 |
6 |
5 |
83.3% |
5 |
83.3% |
1.0 |
0.0% |
| >34 |
5 |
5 |
100.0% |
5 |
100.0% |
1.0 |
0.0% |
MODEL SUMMERY
Model: [Probability of death = elogit / (1+elogit)]
[Logit Equation = -3.895 + (APACHE II) x 0.184]
Hosmer-lemeshow 11.76 (p=0.16)
Predicted Accuracy=77.9%
Area under the curve = 0.823
Calibration is the correlation between the observed mortality and that predicted by the model. The Hosmer Lemeshow test [H-LS 11.76 (p=0.16)] indicates that the overall model fit was good.
The predicted accuracy of the model was 77.9%, sensitivity 90.1% and specificity was 54.9%.
DISCUSSION
The use of scoring systems is not routinely practiced in ICUs across the country due to limited financial resources and lack of man power. In this study 100% mortality was observed at an APACHE II score of >34, so the APACHE II scoring system can be used to identify patients who are not expected to benefit from expensive therapies like ventilatory support, invasive hemodynamic monitoring and support, renal replacement therapies and parenteral nutrition. It also justifies withholding therapy or transferring the patient to less expensive care.
The mean age of patients admitted to SICU was lower than previously reported from a mixed medical/surgical10 and chest ICU11 in Pakistan as well as compared to European counterparts.13 Male preponderance was seen in the SICU population in contrast to previous local studies from predominantly medical ICUs,10,11 but is similar to the European SICU population.13 Trauma admissions are exclusive to SICU (31% of total admissions) and trauma was seen predominantly in males (61 out of 66 patients were male) .
Mean APACHE II score in this study (15.96 ±8.06) was lower than reported from a SICU in Europe13 but higher than reported from a SICU in Barbados14 As recommended by the Scottish Intensive Care Society audit Group 15 in patients who were received in SICU intubated, sedated or paralyzed we either took the pre-sedation GCS or if not documented, presumed it to be normal. This might have underestimated the severity of the patient’s neurological condition in 72.3 % patients admitted to the SICU from operating rooms after elective or emergency surgery, and transferred with tracheal intubation, sedation + neuromuscular blockade and mechanical ventilation. The probability of derangement of neurological status is high in the neurosurgical patients and patients with head injuries and the methodology of the study might have underestimated the APACHE II score and the probability of death. This is reflected by a SMR of 1.15 in the cohort of Neurosurgical patients. The APACHE IV scoring system2 includes an ‘unable to assess GCS’ variable to overcome the predictive inaccuracies caused by defaulting the GCS to normal values.
The APACHE II score of patients received from the operating room (15.45 ± 7.53) was lowest. One of the reasons could be the rigorous resuscitation and meticulous care these patients received by the anesthesia team during surgery, resulting in recovery of the physiological parameters during first 24 hours and underestimating the severity of illness, as was pointed out by Lockrem.16 On the surgical floors, facilities of invasive monitoring and ventilation are not available and such patients get admitted to SICU on priority and resuscitation starts after admission to SICU. The highest admission APACHE II scores (19.52 + 9.51) observed in the group of patients admitted from the surgical floor (ward and surgical special care units) reflects this situation. All these patients fell in the non-operative group, i.e. no surgery was done in these patients in the previous 24 hours. Twelve out of 23 were admitted with septic shock, 7 with acute neurological deterioration, 2 post-cardiopulmonary arrests and 1 each with acute necrotizing pancreatitis and ARDS. This group had a mortality of 39.1% and SMR of 0.9.
The overall ICU mortalityin this study was lower (33%) than the mortality reported previously from Pakistan, from a mixed (45.8%) and chest ICUs (55.9%),10-11 but was higher than the SICU mortality reported by Sakr13 from Europe (6.4%), Hariharan14 from Barbados (15.9%), Chen17 from Singapore (17.27%) and Giangiuliani18 from Italy (21.7%). The SICU population of Aga Khan University hospital is unique in the sense that only 10.8% patients were admitted to the SICU after elective surgery and 61% patients had undergone emergency surgeries and 27.7% patients were received from surgical floors and emergency room. The mortality ratio of the elective and emergency surgery patients was 0.75 and 1.02 respectively and mortality was lower than predicted value in the elective surgery group only. The mortality ratios also vary when the SICU population was broken down by the primary service department. Patients admitted in the service of obstetrics and gynecology was at a low risk of death with a mortality ratio of 0.5. The group labeled “others” displayed an unexpected bad outcome. This group included four patients from the orthopedic service and three patients could not survive in this group. Two of these three non-survivors were admitted from the surgical floor with sepsis and one patient underwent emergency surgery for an infected implant. One patient in the ‘other’ group was admitted under the service of vascular surgery with a ruptured abdominal aortic aneurysm and expired and one cardiothoracic patient who survived was admitted to SICU due to non-availability of bed in the cardiac ICU. Patient characteristics and quality of ICU care are not the only factors that affect the ICU outcome. Factors not included in the prognostic models like response to disease, the surrounding environment and the effect of treatment also affect survival.19 Lead-time bias influences patient outcome20 and is not accounted for in the APACHE II system, but is included in the APACHE IV scoring system.
In our cohort of 213 surgical patients the APACHE II scoring system showed a good calibration (H-L 11.76 (p = 0.16) in contrast to the poor calibration shown by the same scoring system in a large cohort of 1851 SICU patients in Germany. For comparison of care between ICUs and for clinical trials better calibration is needed.13 However, from an individual patient’s point of view it is preferable to have a better discrimination which is apparent in our population as compared to the German SICU population (0.82 vs. 0.80). The small sample size was maybe responsible for the better performance of APACHE II scoring system. Most of the previous studies21 report a high specificity of the APACHE II scoring system for predicting death in ICU patients but a low sensitivity and the results of our study are comparable (specificity of 90.1 % and sensitivity of 54.9%).
Limitations: A major limitation of this study is the retrospective study design that resulted in exclusion of over 60% cases due to incomplete data retrieval. Retrospective methodology requires robust Clinical Information Systems (CIS), Health Information and Management Systems (HIMS), and dedicated data entry in patient’s medical records. Only few hospitals in Pakistan have such systems in place, therefore it is recommended that studies requiring input of multiple physiological variables and other information should be conducted prospectively to avoid the problem of misplaced files and incomplete information.
CONCLUSIONS
Even though the APACHE II score cannot be used to predict mortality in an individual patient, it is suggested that all ICUs across the country should adopt this simple scoring system that incurs no additional cost to grade the severity of illness to identify patients at a high or low risk of death to justify clinical decisions. In centers where financial and human resources are available, APACHE IV scoring system tend to be a suitable option to avoid the inaccuracies associated with defaulting the GCS to normal and not accounting for the lead time bias.
AKNOWLEDMENTS
We are greatly indebted to;
Dr. Hameedullah: Director SICU, Aga Khan University for his involvement in protocol development.
Mr. Amir Raza: Research coordinator, Department of Anesthesiology, Aga Khan University for statistical assistance.
REFERENCES
- Keegan MT, Gajic O, Afessa B. Severity of illness scoring systems in the intensive care unit. Crit Care Med 2011;39:163-9. [PubMed]
- JE. Zimmerman, AA. Kramer, DS. McNair, FM. Malila. Acute physiology and Chronic Health Evaluation (APACHE) IV: Hospital Mortality assessment for today’s critically ill patients. Crit Care Med 2006;34:1297-1308. [PubMed]
- Markgraf R, Deutschinoff G, Pientka L, Scholten T. Comparison of acute physiology and chronic health evaluations II and III and simplified acute physiology score II: a prospective cohort study evaluating these methods to predict outcome in a German interdisciplinary intensive care unit. Crit Care Med 2000;28:26-33. [PubMed]
- Kalb PE, Miller DH. Utilization strategies for intensive care units. JAMA 1989;261:2389-95. [PubMed]
- Detsky AS, Sticker SC, Malley AG, Thibault GE. Prognosis, survival, and the expenditure of hospital resources for patients in an intensive care unit. N Engl J Med 1981;305:667-72. [PubMed] [Free Full Text]
- Knaus WA, Draper EA, Wagner DP, Zimmerman JE: APACHE II-A severity of disease classification system. Crit Care Med 1985;13:818-829. [PubMed]
- Murphy-Filkins R, Teres D, Lemeshow S, Homers DW. Effect of changing patient mix on the performance of an intensive care unit severity-of-illness model: How to distinguish a general from a specilalty intensive care unit. Crit Care Med 1996;24:1968-1973. [PubMed]
- Higgins TL, Teres D, Nathanson B: outcome prediction in critical care: The Mortality Probability Models. Curr Opin Crit Care 2008;14:498-505. [PubMed]
- Afessa B, Gajic O, Keegan MT: Severity of illness and organ failure assessment in adult intensive care units. Crit Care Clin 2007;23:639-658. [PubMed]
- Naved SA,Siddiqui S,Khan FH. APACHEII Score Correlation with Mortality and Length of stay in an Intensive Care Unit. J Coll Physicians Surg Pak. 2011. 21:4-8. [PubMed] doi: 01.2011/JCPSP.0408.
- Haidri Fr, Rizvi N, Motiani B. Role of apache score in predicting mortality in chest ICU. J Pak Med Assoc 2011.61:589- 92. [PubMed]
- Jamil B, Qureshi KA, Khan M, Ujan VA. Assessment of Four Mortality Prediction Models in Intensive Care Unit Patients with Sepsis. Infectious Diseases Journal of Pakistan 2004: 93-95.
- Sakr Y, Krauss C, Amaral AC, Réa-Neto A, Specht M, Reinhart K, et al. Comparison of the performance of SAPS II, SAPS 3, APACHE II, and their customized prognostic models in a surgical intensive care unit. BJA 2008;101:798-803. [PubMed] [Free Full Text]
- Hariharn S, Moseley HS, Kumar AY. Outcome evaluation in a surgical intensive Care unit in Barbados. Anaesthesia, 2002;57:434-41. [PubMed]
- Livingston BM, Mackenzie SJ, MacKirdy FN, Howie JC. Should the pre-sedation Glasgow Coma Scale value be used when calculating Acute Physiology and Chronic Health Evaluation scores for sedated patients? Scottish Intensive Care Society Audit Group. Crit Care Med 2000;28:389-94. [PubMed]
- Lockrem JD, Lopez E, Gallagher J, Church GE, Estafanous FG. Severity of illness: APACHE II analysis of an ICU population. Cleveland Clinic Journal of Medicine Nov-Dec 1991;58:477-486. [PubMed]
- Chen FG, Koh KF, Goh MH. Validation of APACHE II score in a surgical intensive care unit. Singapore Med J 1993;34:322-4. [PubMed]
- Giangiuliani G, Mancini A, Gui A. Validation of a severity of illness score (APACHE II) in a surgical intensive care unit. Intensive Care Med 1989;15:519-22. [PubMed]
- Ohno-Machado L, Resnic FS, Matheny ME: Prognosis in critical care. Annu Rev Biomed Eng 2006;8:567-599. [PubMed]
- Tunnell RD, Miller BW, Smith GB. The effect of lead time bias on severity of illness scoring, mortality prediction and standardized mortality ratio in intensive care- a pilot study. Anaesthesia 1998;53:1045-1053. [PubMed]
- Eric J. Gartman, Brian P. Casserly, Douglas Martin and Nicholas S. Ward. Using serial severity scores to predict death in ICU patients: a validation study and review of the literature. Curr Opin Crit Care. 2009 Dec;15(6):578-82. [PubMed] doi: 10.1097/MCC.0b013e328332f50c.
